• Home
  • Forums
  • Trades
  • News
  • Calendar
  • Market
  • Brokers
  • Login
  • Join
  • User/Email: Password:
  • 10:23am
Menu
  • Forums
  • Trades
  • News
  • Calendar
  • Market
  • Brokers
  • Login
  • Join
  • 10:23am
Sister Sites
  • Metals Mine
  • Energy EXCH
  • Crypto Craft

Options

Bookmark Thread

First Page First Unread Last Page Last Post

Print Thread

Similar Threads

EUR/GBP, EUR/USD, GBP/USD, AUD/USD, CAD, NZD, JPY, and more... 14 replies

Can only view EUR/USD, GBP/USD, USD/JPY, USD/CHF through broker? 1 reply

If you buy gbp/usd and sell eur/usd, is that the same as being short eur/gbp? 1 reply

Using usd/chf - eur/usd correlation to see moves in EUR/USD 46 replies

eur/usd, eur/jpy, usd/jpy average 0 replies

  • Commercial Content
  • /
  • Reply to Thread
  • Subscribe
  • 13
Attachments: fOcuS @ EUR/USD
Exit Attachments
Tags: fOcuS @ EUR/USD
Cancel

fOcuS @ EUR/USD

  • Last Post
  •  
  • 1 Page 234 5
  • 1 Page 234 5
  •  
  • Post #21
  • Quote
  • Feb 28, 2008 5:12am Feb 28, 2008 5:12am
  •  Lifesong
  • | Joined Sep 2007 | Status: Member | 24 Posts
Hi John

Thanks for your continued posts and would you please clarify whether you're a day trader or swing trader? I believe the danger with any analysis is that it is subject to the timeframe you are using for your analyis. Sometimes it happens that someone will use your trade ideas, but with a totally different timeframe in mind and it will end up in a disaster with the other person feeling that you're to blame for the loss. My suggestion is that you qualify whether it is an intraday analysis or a longer term view. As you know the shorter your timeframe of reference, the higher probability that someone reads the post a few hours after you've made it and still thinks that your analysis is still valid, but ultimately that opportunity is already history. Also price action gives us shorter term opportunities that sometimes is against the overall trend and this is a high risk way of trading.

I attach a link that you could find valuable
http://www.moneyshow.com/msc/investo...293be49fb537e3

Happy trading and good luck
 
 
  • Post #22
  • Quote
  • Feb 28, 2008 11:06am Feb 28, 2008 11:06am
  •  johntsai
  • | Joined Apr 2007 | Status: Member | 450 Posts
Quoting blyestyachee
Disliked
Im sorry, I mean no offense, so with respect I might suggest you are over using technicals under these market conditions. I trade euro/usd and the trade has very clearly been long upon the break above 1.4700. Im weening off of the technicals and trying to learn the P/A methods and more fundamental. Just my two cents. Thank you for your blog.
Ignored
thx for the posting.

first thing i have to admit, i am pure technical trader. I will use as many techinic analysis that helpful for me to make decision right the way.

for my last post, the main mistake i make is i should not expect price to reach the major level once it still at uptrend.

anyway, loser learned. i am doing another trade last night, and comes out great. i will post the analysis today.
 
 
  • Post #23
  • Quote
  • Feb 28, 2008 11:08am Feb 28, 2008 11:08am
  •  johntsai
  • | Joined Apr 2007 | Status: Member | 450 Posts
Quoting Lifesong
Disliked
Hi John

Thanks for your continued posts and would you please clarify whether you're a day trader or swing trader? I believe the danger with any analysis is that it is subject to the timeframe you are using for your analyis. Sometimes it happens that someone will use your trade ideas, but with a totally different timeframe in mind and it will end up in a disaster with the other person feeling that you're to blame for the loss. My suggestion is that you qualify whether it is an intraday analysis or a longer term view. As you know the shorter your timeframe of reference, the higher probability that someone reads the post a few hours after you've made it and still thinks that your analysis is still valid, but ultimately that opportunity is already history. Also price action gives us shorter term opportunities that sometimes is against the overall trend and this is a high risk way of trading.

I attach a link that you could find valuable
http://www.moneyshow.com/msc/investo...293be49fb537e3

Happy trading and good luck
Ignored
thx for the post.

i appreciate your suggestion. my lowest timeframe to trade is hour chart. there will be no lower then that.

for the analysis, i try to point out the major resistance and support all the time. so trader can make them as reference when they entry or analysis the chart.

new post coming soon.
 
 
  • Post #24
  • Quote
  • Feb 28, 2008 11:11am Feb 28, 2008 11:11am
  •  johntsai
  • | Joined Apr 2007 | Status: Member | 450 Posts
open trade today.

day chart macd is up.
hour chart form sk, and price hold above it.
sto cross up for entry. right aroun above the sk.

position open at
o 15110 / sl 15064 / tp 15149

previous analysis i mentioned weekly resistance is 15149
it finally got here.

now the next resistance target will be weekly fib ext 1618 level 15666
swing high is not form yet. so there is no updated support.

ps watch out the trenline. as long as price pull back, buy the deep.
 
 
  • Post #25
  • Quote
  • Feb 28, 2008 3:26pm Feb 28, 2008 3:26pm
  •  johntsai
  • | Joined Apr 2007 | Status: Member | 450 Posts
Finally, we got the swing high formed.

Here is out next potential position setup.

Major support = SK = 15152
Major resistance = fib ext 1618(4h chart) = 15271

as long as day or 4h macd still up, enter when price reach support or sto oversold then cross up.

we will want to see this happen before this position open.
 
 
  • Post #26
  • Quote
  • Feb 29, 2008 11:50am Feb 29, 2008 11:50am
  •  johntsai
  • | Joined Apr 2007 | Status: Member | 450 Posts
Position opened last night and this morning.

due to day chart macd is up, we are still in uptrend.
4h trendline hold the price this morning above sk with h sto oversold then cross up. this is the second entry signal. the fist signal was not reached sk yet, but h sto cross up for my first trigger.

price hanging around right above sk level. price have to respect the sk to confirm current uptrend move.

position opened last nit and this morning.

position 1) o 15192 / sl 15129 / tp 15272
position 2) o 15164 / sl 15129 / tp 15272

this two entry have h sto cross up after oversold. they are both a good entry signal and confirmation that sk might hold the price for the continue uptrend move.

ps if the trade didnt mention paper trade, they are all live acct trade.
 
 
  • Post #27
  • Quote
  • Feb 29, 2008 1:17pm Feb 29, 2008 1:17pm
  •  blyestyachee
  • | Membership Revoked | Joined Feb 2008 | 31 Posts
Thankyou for your openness with your trades. Im wondering if I could get yoru opinion on something I have tussled with. I mainly use 55/200 SMA on a 30 minute chart but I am trying to learn more fundamentals and especially learn price action indicators.

For example we start week with euro/usd trading light around 1.4800 and then as it appears some Fed officials speak about weak usd fundamentals for a few days and then Bernanke speak about weak fundamentals and rate cuts and market take euro/usd ups 400 pips.

When using our technicals how do we account for such events that are market moving? Thank you.
 
 
  • Post #28
  • Quote
  • Feb 29, 2008 2:03pm Feb 29, 2008 2:03pm
  •  johntsai
  • | Joined Apr 2007 | Status: Member | 450 Posts
Quoting blyestyachee
Disliked
Thankyou for your openness with your trades. Im wondering if I could get yoru opinion on something I have tussled with. I mainly use 55/200 SMA on a 30 minute chart but I am trying to learn more fundamentals and especially learn price action indicators.

For example we start week with euro/usd trading light around 1.4800 and then as it appears some Fed officials speak about weak usd fundamentals for a few days and then Bernanke speak about weak fundamentals and rate cuts and market take euro/usd ups 400 pips.

When using our technicals how do we account for such events that are market moving? Thank you.
Ignored
thanks for the posting.

first thing i want to clarify. to gain 400 pips is not very often, and is not easy.
for me, i always aime for 50-100 pips max according to the current support and resistance level.

if you want to learn more fundamental, i strongly suggest you to find a mentor who can help you out. because its just cant explain in one simply post. especially in the journal session.

here are the list of my mentors for your reference:
my first mentor who taugh me the fundamental is peter bain (www.forexmentor.com)
then i study a lot of strategy from other experts.
that included vic noble (forexmentor mentor),
mark braun (www.fibonaccitrade.com),
and my favor one neal haughes (www.fibmarkets.com).

the main tech tool i use are macd8,17,9, sto 8,3,3. trendline, SMA 3x3, fib ratio and fib ext only.

i always look for trendline, then support and resistance level. after that i confirm with sto and macd.

this is my way to trade.

if you have any other question, feel free to let me know.
 
 
  • Post #29
  • Quote
  • Feb 29, 2008 4:01pm Feb 29, 2008 4:01pm
  •  johntsai
  • | Joined Apr 2007 | Status: Member | 450 Posts
position result

due to 4h macd cross down in good 45degree angle, im not going to hold through the weekend. instead, we might want to see trendline break next week in order to entry short and aim the closest support level.

otherwise we want to see macd 4h cross back up or sto cross back up to aime our last resistance we just did last nit.

both position closed. positive result on both.
 
 
  • Post #30
  • Quote
  • Feb 29, 2008 7:15pm Feb 29, 2008 7:15pm
  •  johntsai
  • | Joined Apr 2007 | Status: Member | 450 Posts
analysis for the following week:

we are all happy to see price finally break the 14816 resistance level this week. right now, the price had reach weekly target at fib ext 100=15139
now, it is the time to take a deep breath before heading to the next target at fib ext 1618=15638

before the market closed, i had close my position from last nit and the one in this morning with positive pip into the acct. the main reason is i see 4h macd cross down with 45 degree angel. this indicate pull back move is going to start soon or later.

for next week, we need 4h trendline and sk=15138 to be break before take any short action. then i will expecting a deep pull back to the support sk=14949. this level is hold with day chart trendline.

then it might be another chance for the long setup again.

once again, we alway want to see macd and sto confirmation before take the action on the long position setup.

i will keep eye on it and post any new update i see.

have a great weekend. ^^
 
 
  • Post #31
  • Quote
  • Edited 11:52am Mar 7, 2008 11:10am | Edited 11:52am
  •  johntsai
  • | Joined Apr 2007 | Status: Member | 450 Posts
New position found today.

Price havnt reach the target price 15448 from day chart.
wk macd and sto both up. its good for long trade opportunity.

entry when 5min macd cross up.
other signal can be found in other time frame's macd cross up.

o 15379 / sl 15359 / tp 15448.

but during LO open, Twizzer top formed at 15min. i scare out with 20pip profits.

This morning found the target reached. so the idea still fullfill.
target price had reached.
 
 
  • Post #32
  • Quote
  • Mar 7, 2008 1:15pm Mar 7, 2008 1:15pm
  •  johntsai
  • | Joined Apr 2007 | Status: Member | 450 Posts
Once I reviewing my mentor's course, i learned some new ideas.
I would like to post it up here for more discussion.

This idea is very simple. Always ask yourself.
Where is price?(resistance/support)
What price doing?(break up/break down)
What price pattern recognize near resistance/support?(triangle,chanel,head and shoulder...etc)
How about trendline,MACD,STO?(up/down)

By asking yourself those questions, you can easily know what is your next step on the price action.

By using FIb Ext, you can find resistance
By using SK, you can find support
By using MACD, you can find entry pt
 
 
  • Post #33
  • Quote
  • Mar 7, 2008 1:46pm Mar 7, 2008 1:46pm
  •  johntsai
  • | Joined Apr 2007 | Status: Member | 450 Posts
Last nit was a great trade, the target price reached resistance 15446.

Today, I see another setup that going to happen again.

Here is new analysis.

We saw price reached target at 4H fib ext 61.8=15446(resistance) this morning.Then the price drop down and break our first uptrend sk line right at 15381 area. right now, the price is consolidate second sk line 15331.

confirm direction by using 4h. macd and sto both down.
good opportunity for short.

in the 30m chart, we see price is consolidate as downtrend triangle right at sk. this mean is gona break down again due to this price pattern.

i use another fib ext from there, and get my target price right at fib ext 618=15275=uptrend fib ratio 618=15266. this consider another great cluster for sk level.

position enter by using 5min macd cross back down again for short entry.

position open as follow:

o 15326 / sl 15357 / tp 15275

p.s. some note by applying new ideas.

what is price doing?

price is break down sk, and consolidate at next sk as downtrend triangle.

what is macd,sto,and trendline doing?

h trendline break, 4h macd and sto both down.
 
 
  • Post #34
  • Quote
  • Mar 7, 2008 5:08pm Mar 7, 2008 5:08pm
  •  johntsai
  • | Joined Apr 2007 | Status: Member | 450 Posts
Finally, I have chance to put up picture. ^^

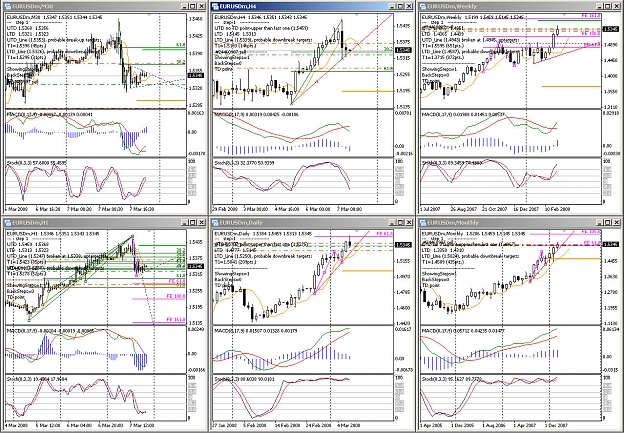
Anaylysis Review:

mth: price reached fibext 618 resistance
wk: price above fib ext100, targeting fib 1618
macd and sto both up
d: fib ext 618 reached
4h: macd and sto both down, trendline hold
expecting break out and pull back to fib 618.
h: 15375 area sk break, price consolidate at 15345 sk area
m30: price consolidate potential downtrend triangle right at 15345 sk area

m5: entry at macd cross down. stop at m30 fib 38.2. target at h fib ext 61.8 which cluster with h fib 61.8 become sk level.

Detail Position can be find at previous post.

--------------------------------------------------------------------
Short term trade

Trade for pull back to day trendline (expecting d trendline hold)

Long term trade

Expecting price hit wk fibext 1618
Attached Image (click to enlarge)
Click to Enlarge

Name: 030708 position.jpg
Size: 365 KB
 
 
  • Post #35
  • Quote
  • Mar 10, 2008 11:02am Mar 10, 2008 11:02am
  •  johntsai
  • | Joined Apr 2007 | Status: Member | 450 Posts
Position Result failed.

The downtrend triangle fail to break down.

Position closed by hitting stop.
 
 
  • Post #36
  • Quote
  • Mar 14, 2008 1:50pm Mar 14, 2008 1:50pm
  •  johntsai
  • | Joined Apr 2007 | Status: Member | 450 Posts
This thread will be closed.

Because I open another one in trading system area.
That shows how I use the setup to trade my live acct.

Here is the link:
http://www.forexfactory.com/showthread.php?t=75149

I appreciate your support. Thanks for visiting.
 
 
  • Post #37
  • Quote
  • May 18, 2008 2:39am May 18, 2008 2:39am
  •  johntsai
  • | Joined Apr 2007 | Status: Member | 450 Posts
Chart anaylsys update 05-17-08

current price level is 15582, and potential uptrend continuation had kick in action.

since price bounce hardly from the level of 15450, it mean the current support trendline had hold the uptrend price movement. Now, the price comes to the previous high from 5/12/08 level which is 15550 with a huge bullish candle. At this point, possible upward movement going to hit 15650. This level comes from fib ext 1618 and MA 200.

From now, we will want to buy in deep and hold till the level or sell with profit target hit.

Happy trade for the following week.
 
 
  • Post #38
  • Quote
  • May 19, 2008 4:49am May 19, 2008 4:49am
  •  johntsai
  • | Joined Apr 2007 | Status: Member | 450 Posts
Current price is almost reach the target fib ext 1618, 15638 (resistance)

Once it hit, we want see divergent formed and other sign to confirm the pull back action toward 15550(support) or lower level before hit the longer target around 15750.
 
 
  • Post #39
  • Quote
  • May 19, 2008 7:04am May 19, 2008 7:04am
  •  jackt
  • | Joined Jun 2004 | Status: Member | 91 Posts
Quoting johntsai
Disliked
Current price is almost reach the target fib ext 1618, 15638 (resistance)

Once it hit, we want see divergent formed and other sign to confirm the pull back action toward 15550(support) or lower level before hit the longer target around 15750.
Ignored
Could you post a chart. Thanks.

me too watching bounce of 15550 using mtf stoch method.
 
 
  • Post #40
  • Quote
  • May 19, 2008 11:13am May 19, 2008 11:13am
  •  johntsai
  • | Joined Apr 2007 | Status: Member | 450 Posts
price currently at 15511.

after price reached about 8 pips short from our 15638 price, i realize we are at major price decision=15600.

macd his divergent formed with 4h sto cross down. our original 1618 ext target reached from a=15283 b=15488 c=15365. Confirming with volume shrink.

Our top had complete builded. now is time to see further down more. find the deep to short is out current trade strategy.

The purple of this thread is record my analysis developing. you are willing to join into the discussion of price prediction. But, please no strategy question involved nor picture request to post. You also welcome to use my infrmation as a reference while you are in the decision of trading.

Good luck everyone and thanks for visiting.
 
 
  • Commercial Content
  • /
  • fOcuS @ EUR/USD
  • Reply to Thread
    • 1 Page 234 5
    • 1 Page 234 5
0 traders viewing now
  • More
Top of Page
  • Facebook
  • Twitter
About FF
  • Mission
  • Products
  • User Guide
  • Media Kit
  • Blog
  • Contact
FF Products
  • Forums
  • Trades
  • Calendar
  • News
  • Market
  • Brokers
  • Trade Explorer
FF Website
  • Homepage
  • Search
  • Members
  • Report a Bug
Follow FF
  • Facebook
  • Twitter

FF Sister Sites:

  • Metals Mine
  • Energy EXCH
  • Crypto Craft

Forex Factory® is a brand of Fair Economy, Inc.

Terms of Service / ©2023