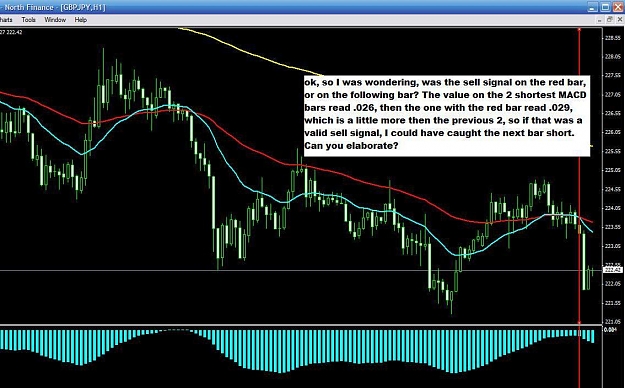
Your contributions are always appreciated. Thanks for this new system. Question on an entry: The attached picture seems to show a good entry but then a drawdown of about 165 pips while the MACD and OSMA are continuing their downtrends. Comments? Thanks again.
Ignored
Ignore the trends. Simply follow the signals as defined for this system. You will find that it works very nicely...
I have personally made out very well with this system. 100% mechanical with very little jitter (false trades).
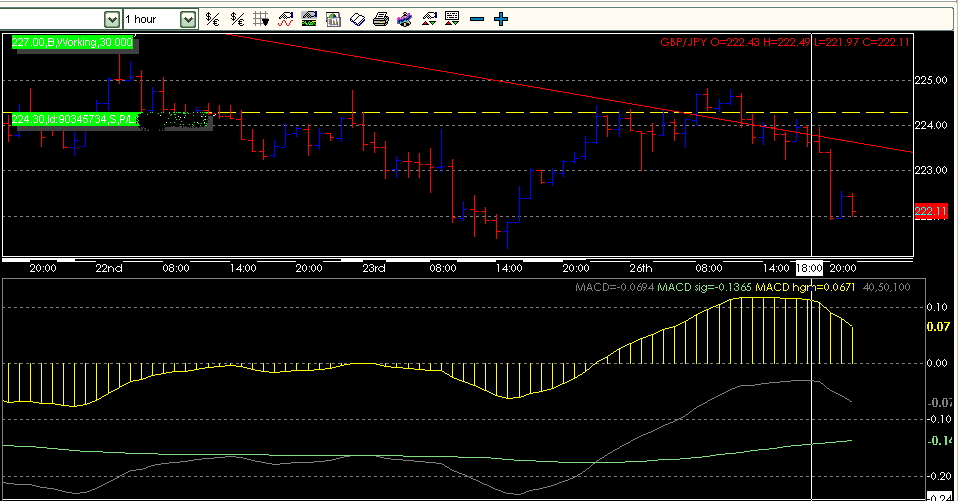
The GBP/JPY created a sell signal on the last hourly bar at 223.41. Did anybody catch the signal beside me?
Thanks,
TK
Ignored
Welcome back Tkimble
Maybe it could be useful if you tell us which broker do you use to pick signal since users use different broker and cannot see your trade. I think this could help a lot to avoid misunderstanding on your entry/exit.
|
Joined Nov 2006
|
Status: Fightin' Gator
|121 Posts
Hi tkimble
Thanks for sharing your new system.
Is your stop loss static (set at the beginning of the trade and kept there throughout) or do you trail it as the trade progresses to protect your profits?
This seems to be a very simple & profitable system from what I have seen so far using it in DEMO MODE. What is the lowest TF you would advise to use as I have only tried the 1Hr, but have a preference for the 15Min if that would work.
Over the last several months I have reviewed your methods & I must say you need to put these into a book format. Some would most likely make nice EA's
if your into that. No doubt you have the ability to develope some really nice methods that should appeal to a broad range of traders.
Tks
AceTrader
Ignored
You must trade according to a timeframe that best suits your lifestyle. For me, it is the hourly chart becuase I like the hour thrill and can stay on top of an hourly chart. The smaller the timeframe, the more attention you must pay to the chart...
Is your stop loss static (set at the beginning of the trade and kept there throughout) or do you trail it as the trade progresses to protect your profits?
Thanks
Start with 50 PIP stop. I have at times used a 150 PIP TR which has worked nicely for me...
Tks for reply. I will give the 15M tf a go & see what happens. Your correct the shorter the tf the more attention needed. This is a nice method that I t have just got to try. Will update you along the way. Tks & good trades to you.
This is by far my most profitable system and very simple.
1. Works with all types of time frames (hourly, 4 hour, daily, weekly, monthly).
2. Create a MACD or OsMA chart using the following parameters:
Fast EMA 40
Slow EMA 50
Signal SMA 100
3. The MACD and/or OsMA value will change for every price bar.
4. Use 50 PIP stop on all trades...
Buy Signal: When the current price bar MACD or OsMa signal is greater than the previous price bar MACD or OsMA value
Sell Signal: When the current price bar MACD or OsMA signal is less than the previous price bar MACD or OsMA value
That is is. This system will allow execution of buys at the very low point of a trend and the exeuction of sells at the very high point of trends...
Your only preference should be the timelines. If you have time to monitor the market daily, use the hourly chart. If not, use the 4 hour or daily chart. The greater the timeline, the fewer the trades.
I have been successfully trading this system using a one hour chart.
Enjoy,
TK
Ignored
Thank you for this system!
Do you take every signal it generates?
If you got a long signal then a short signal was generated before you exited or before your stop was hit would you take the short and exit your current long?
Anyone who has more chart examples please post them...pictures work so well in describing entries/exits.
This seems to be a very simple & profitable system from what I have seen so far using it in DEMO MODE. What is the lowest TF you would advise to use as I have only tried the 1Hr, but have a preference for the 15Min if that would work.
Over the last several months I have reviewed your methods & I must say you need to put these into a book format. Some would most likely make nice EA's
if your into that. No doubt you have the ability to develope some really nice methods that should appeal to a broad range of traders.
Tks
AceTrader
Ignored
Thanks for the words. My thrill comes from profitable trading and helping others achieve the same. Let the others worry about the books. I like focusing on profitable trading...
Welcome back Tkimble
Maybe it could be useful if you tell us which broker do you use to pick signal since users use different broker and cannot see your trade. I think this could help a lot to avoid misunderstanding on your entry/exit.
This is by far my most profitable system and very simple.
1. Works with all types of time frames (hourly, 4 hour, daily, weekly, monthly).
2. Create a MACD or OsMA chart using the following parameters:
Fast EMA 40
Slow EMA 50
Signal SMA 100
3. The MACD and/or OsMA value will change for every price bar.
4. Use 50 PIP stop on all trades...
Buy Signal: When the current price bar MACD or OsMa signal is greater than the previous price bar MACD or OsMA value
Sell Signal: When the current price bar MACD or OsMA signal is less than the previous price bar MACD or OsMA value
That is is. This system will allow execution of buys at the very low point of a trend and the exeuction of sells at the very high point of trends...
Your only preference should be the timelines. If you have time to monitor the market daily, use the hourly chart. If not, use the 4 hour or daily chart. The greater the timeline, the fewer the trades.
I have been successfully trading this system using a one hour chart.
Enjoy,
TK
Ignored
tk,can u pls post your entry/exit with your system on charts,thanks
The GBP/JPY created a sell signal on the last hourly bar at 223.41. Did anybody catch the signal beside me?
Thanks,
TK
Ignored
Great seeing u again TK. Have been looking forward to testing your new system like so many. I was out of town and just got back to my charts.
On the GBY 1 hr chart, (trading w IBFX) i had a high 225.43 and 225.35 at the close. Was going to ask if you wait for the signal bar to be taken out or do you enter the posiiton immediatelyh at the close.
I took a quick look, and it looks that if you put a stop to take out the signal bar you will eliminate a large number of "color changes" and even further minimze false signals.
Will take time to back test it. I trade the 4 hre GBY and EUR charts so those are where i will focus. Will look at 1 hr as well.