DislikedMan, some of those charts looks like an old school nintendo game when it froze up. How the hell do you trade or even understand those charts?Ignored
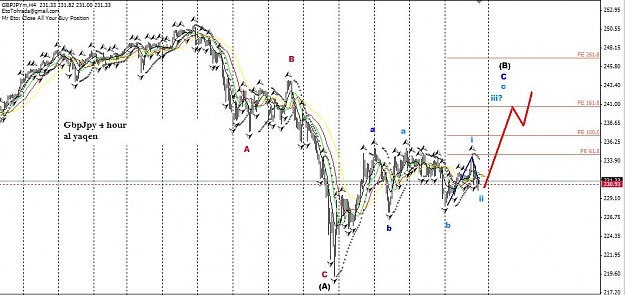
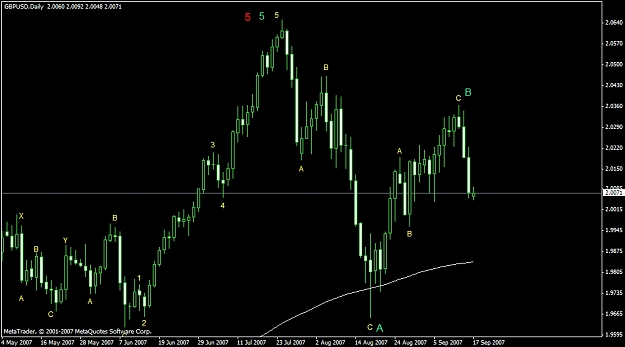
1st I use EW for General Direction
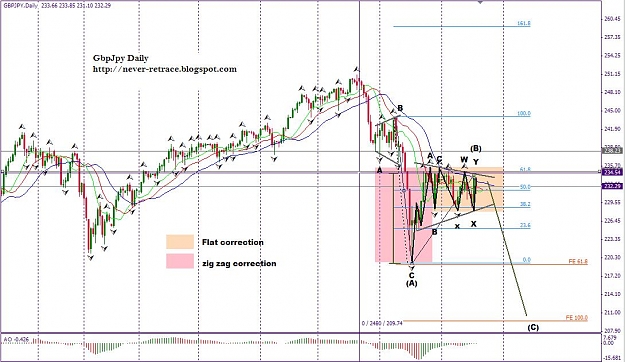
2nd I use Andrew's Pitchfork to create Channels and Simulate Support and Resistance Levels
3rd Trendlines are also drawn for Resistance and Support Levels
4th You will see FIB Retracement Tools ( for Wave 2, 4 and B ) and FIB Extention Tools to help Project Levels for Wave 3, 5 and C.
I only Presented it here to show how I do it starting from the monthly down to the lower time frames.
You will not understand the notations on the lower time frame unless you analyze starting from the monthly chart.
EG
PS.
It is all in the mind and probably requires an effort to concentrate.