Joined Feb 2009
|
Status: Down to Earth!
|2,358 Posts
The US M2 Money Supply data for January 2025 has been released: inflation is only +0.06%.
This is much better compared to the previous inflation rate of approximately +0.40%.
Summary
3 x failed upside b/o's of the previous wk's 2678 hi (2690, 2716, and 2689) characterised the week just closed, before the drop off from Wednesday's 2716 and the wk's hi. Friday saw a failed 1st small downside b/o of the previous wk's 2662 lo. Price opened the New Year below it's 2749 pivot, and has thus far stayed below it, traveling 616 pips so far this yr.
Specifically * Mthly The < 6mth amr (94%) mthly candle did indeed close as a bullish engulfing of January's candle. The t/f may be ranging or in something of a general uptrend, but they 2110 February/current yrly lo is a L (below the last HL @ 2300,) on this t/f, after the 3434 HH. Price closed the mth out above it's Mthly Pivot (which is @/around 2354,) and should (barring any gaps @ the new open,) open above the new Monthly Pivot which will be @/around 2514. * Wkly The < 13wk awr (67%) wkly candle closed bearishly, perhaps a bearish hammer? The t/f closes the week in a general downtrend, and below it's Wkly Pivot (which is @/around 2524.) Price should open the new week below it's new Wkly Pivot, which will be @/around 2716. * Dly Fri's < 30day adr (64%) dly candle closed as a bearish-bodied non-descript candle? The t/f is still in a general uptrend, but after 3 x consecutive HL's (2332, 2562 then 2606,) there will be a L printed @ Fri's/last wk's lo or lower, when it forms fractally on this t/f. Fri's lo challenged layered (coexistent) prev sw hi zones on this t/f that may act as rbs (they did @ Fri's lo already,) and extend down to circa 2507. Price closed below Fri's Dly pivot, and should open just below Mon's Dly Pivot which will be @/around 2587. * 4Hr The last candle close on this t/f was an effective bearish-bodied hammer. The t/f may be entering a new downtrend? * 1Hr The last 1hr candle close was bearish creating a LH on this t/f, in it's general downtrend.
NB: Interesting that J.P.Morgan issued an update this last trading week just ended saying effectively that they are looking for a dip from current levels and will be buyers on any approach to 2000 for a run up to 3200, or higher. Technically, a bit of a mixed bag re trends across the 1hr+ t/f's @ the wk's/mth's close, but a strong sell-off from the 2716 current yrly hi this week just closed. Fundamentally, Trump's tariffs and a U.s govt funding fight/possible U.s Govt shutdown that could happen as a result of no agreement on the former, both 'loom large' into the new month of March, as the Ukraine thing takes a turn for the worst, diplomatically at least.
W/e analysis Summary 3 x failed upside b/o's of the previous wk's 2678 hi (2690, 2716, and 2689) characterised the week just closed, before the drop off from Wednesday's 2716 and the wk's hi. Friday saw a failed 1st small downside b/o of the previous wk's 2662 lo. Price opened the New Year below it's 2749 pivot, and has thus far stayed below it, traveling 616 pips so far this yr. Specifically * Mthly The < 6mth amr (94%) mthly candle did indeed close as a bullish engulfing of January's candle. The t/f may be ranging or in something of a general uptrend, but they 2110 February/current yrly lo is a L (below the last HL @ 2300,) on this t/f, after the 3434 HH. Price closed the mth out above it's Mthly Pivot (which is @/around 2354,) and should (barring any gaps @ the new open,) open above the new Monthly Pivot which will be @/around 2514. * Wkly The < 13wk awr (67%) wkly candle closed bearishly, perhaps a bearish hammer? The t/f closes the week in a general downtrend, and below it's Wkly Pivot (which is @/around 2524.) Price should open the new week below it's new Wkly Pivot, which will be @/around 2716. * Dly Fri's < 30day adr (64%) dly candle closed as a bearish-bodied non-descript candle? The t/f is still in a general uptrend, but after 3 x consecutive HL's (2332, 2562 then 2606,) there will be a L printed @ Fri's/last wk's lo or lower, when it forms fractally on this t/f. Fri's lo challenged layered (coexistent) prev sw hi zones on this t/f that may act as rbs (they did @ Fri's lo already,) and extend down to circa 2507. Price closed below Fri's Dly pivot, and should open just below Mon's Dly Pivot which will be @/around 2587. * 4Hr The last candle close on this t/f was an effective bearish-bodied hammer. The t/f may be entering a new downtrend? * 1Hr The last 1hr candle close was bearish creating a LH on this t/f, in it's general downtrend. NB: Interesting that J.P.Morgan issued an update this last trading week just ended saying effectively that they are looking for a dip from current levels and will be buyers on any approach to 2000 for a run up to 3200, or higher. Technically, a bit of a mixed bag re trends across the 1hr+ t/f's @ the wk's/mth's close, but a strong sell-off from the 2716 current yrly hi this week just closed. Fundamentally, Trump's tariffs and a U.s govt funding fight/possible U.s Govt shutdown that could happen as a result of no agreement on the former, both 'loom large' into the new month of March, as the Ukraine thing takes a turn for the worst, diplomatically at least. Mthly, Wkly, Dly, 4Hr, and 1Hr below. {image} {image} {image} {image} {image}
Ignored
i laid down for a nap at 6:30pm yesterday and kept sleeping till just an hour ago LOL
headland..thank you for that recap of what just transpired during the week...none of us knew that from looking at and trading the chart and you're so good at rehashing the past for us
the monthly candle is bearish not bullish like you just said since it sold off the last 2 days and resting on janurarys high like I said days ago ahead of time that that's what would happen
{quote} bones brought up a monthly chart earlier and I think price will test last months high at 2576 and if closes under means it will range a few more weeks Im still longterm bullish but until march 14 when the government shutdown might start I'm bearish GU {image}
Ignored
so the fact that its a big green candle doesn't mean its bullish....just means its a big green up candle LOL ...you shud really stop confusing people by claiming every big green candle is bullish and big red one is bearish cause you always end up with egg all over your face LOL
with the shit that transpired in the oval office yesterday the dollar gona go up even more...it met my DXY target of 107.50 like the technicals said it would
the dollar chart is relentless and i think will break thru that resistance this time I see DXY going to 107.50ish up until march14th when the stable genius shuts down the government and the dollar falls off a cliff things gona be bad ifn that shutdown happens cause stocks already cracked and prolly started a bear market TSLA and DJT have been falling down since trumps inauguration LOL...musk has lost over 50 billion since then {image}
Ignored
but now it might go to 1.09 because people will buy it for its safe haven status since trump just gave china reasons to invade taiwan without fear of his retribution if they do it since he's rewarding dictators and invaders of countries....i hope all you foreign tards are happy with these trump developments since you wanted him as president cause I'm laughing my ass off since ill be safe in my chicago house while you European tards can quake in your boots now of an possible widening war LOL
{quote} i laid down for a nap at 6:30pm yesterday and kept sleeping till just an hour ago LOL headland..thank you for that recap of what just transpired during the week...none of us knew that from looking at and trading the chart and you're so good at rehashing the past for us the monthly candle is bearish not bullish like you just said since it sold off the last 2 days and resting on janurarys high like I said days ago ahead of time that that's what would happen {quote} so the fact that its a big green candle doesn't mean its bullish....just...
Ignored
Hi, if you read my post again I said that the mthly candle is a bullish engulfing of January's candle, BECAUSE IT IS. I made no comment about whether the candle would likely see a downside or upside follow thru. I stated what type of candle it was, that is all. I did not state whether, given the position of it, or the underlying fundamentals driving price, the market would continue to be bearish or bullish, indeed in the summary I went onto say that technically re trend it's a mixed picture across the 1hr+ t/f's. I therefore am not confusing anyone. This is probably semantics to you who are confusing what a candle actually is, to what the greater probability of future price discovery is given the overall context of an individual candle. There is a difference.
{quote} Hi, if you read my post again I said that the mthly candle is a bullish engulfing of January's candle, BECAUSE IT IS. I made no comment about whether the candle would likely see a downside or upside follow thru. I stated what type of candle it was, that is all. I did not state whether, given the position of it, or the underlying fundamentals driving price, the market would continue to be bearish or bullish, indeed in the summary I went onto say that technically re trend it's a mixed picture across the 1hr+ t/f's. I therefore am not confusing...
Ignored
Hi Headland, " You can take a horse to water but you can't make it drink" .....he is funny though, ask him to explain "hedging" to you it's comedy gold..ROFLMAO
{quote} Hi, if you read my post again I said that the mthly candle is a bullish engulfing of January's candle, BECAUSE IT IS. I made no comment about whether the candle would likely see a downside or upside follow thru. I stated what type of candle it was, that is all. I did not state whether, given the position of it, or the underlying fundamentals driving price, the market would continue to be bearish or bullish, indeed in the summary I went onto say that technically re trend it's a mixed picture across the 1hr+ t/f's....
Ignored
I'm not a nitpicker when it comes to candles or patterns since in real life, trading candles don't resemble the cherry-picked examples in books, however
I personally don't see it as an engulfing candle of anykind since it didn't get near janurarys lows much less a bullish one LOL
so why didn't you just say it was an engulfing candle without adding the word bullish?....you don't see the misunderstanding caused by inserting that word in your description of the candle since it isn't engulfing in the first place LOL...to me its more of an inside close candle but since I didn't work for a bank trading their money like you did I may not know my candlesticks
{quote} I'm not a nitpicker when it comes to candles or patterns since in real life, trading candles don't resemble the cherry-picked examples in books, however I personally don't see it as an engulfing candle of anykind since it didn't get near janurarys lows much less a bullish one LOL so why didn't you just say it was an engulfing candle without adding the word bullish?....you don't see the misunderstanding caused by inserting that word in your description of the candle since it isn't engulfing or bullish LOL...to me its more of an inside close...
mind telling me what DAWS means? i don't speak brit slang
if you continue drunk posting waveskibobski ill have to call longdistance to the creeks end pub and tell the bartender you cant handle your alcohol and that they shud limit you to just 2 pints since you stumble home afterwards and start stupid arguments on the the internet with people
Joined Feb 2009
|
Status: Down to Earth!
|2,358 Posts
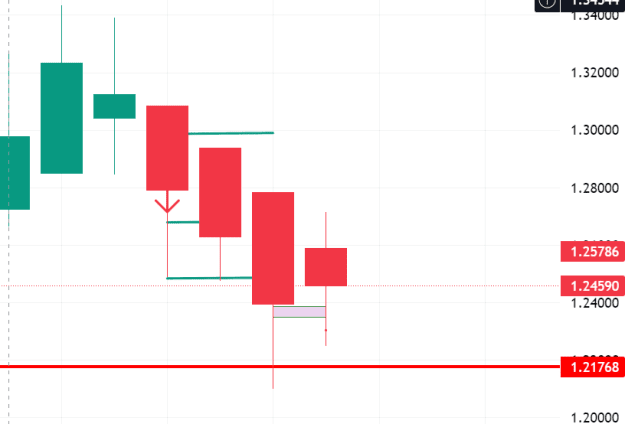
Regarding bullish green candles or bearish red candles, in my PVSRA analysis, I have long stopped coloring each candle as green or red, which is why it is often called colorblind analysis.The colors in the candles shown in this image only indicate volume activity:Red means Max Sell, Green means Max Buy, Blue means Raising Buy, and Purple means Raising Sell.A large volume (high activity) does not always result in a drastic price increase or decrease.
{quote} mind telling me what DAWS means? i don't speak brit slang if you continue drunk posting ill have to call longdistance to the creeks end pub and tell the bartender you cant handle your alcohol and that they shud limit you to just 2 pints since you stumble home afterwards and start stupid arguments on the the internet with people
Regarding bullish green candles or bearish red candles, in my PVSRA analysis, I have long stopped coloring each candle as green or red, which is why it is often called colorblind analysis. The colors in the candles shown in this image only indicate volume activity: Red means Max Sell, Green means Max Buy, Blue means Raising Buy, and Purple means Raising Sell. A large volume (high activity) does not always result in a drastic price increase or decrease. Lel {image}
Ignored
that's pretty good
when I'm in doubt about something ill switch to heiken ashi candles and even that monthly candle isn't bullish nor is it green LOL
I don't mind passing along that tidbit since I know my enemies wont use it since it came from me LOL