Why this two similar set up gives two different result. The RED set up failed to bounce up after clearing the RBS zone The BLUE set up price bounce the RBS zone. {image}
... 2678 Current dly hi - after y/day's 4th but more decisive upside b/o of last wk's 2630 hi, (the 1st 3 to a max of 2638,) finally saw last wk's bullish thrust engulf x 3 candle on the wkly t/f exercise some influence with the upside follow-thru. Will Y/day's similar dly candle exercise the same influence, @ some point? We'll see.
Only 48% of 13wk awr traveled so far this wk. 30day adr down to 105 from a 114 recent hi.
{quote} CABLE Waititng for bounce ? Watch FVG/ Fib{image}
Ignored
Hi. Yeh, - a perhaps growing pattern of 1hrbullish hidden div is already present - could stay good whilst price above 2596. I wonder though, if tested, whether that 4hr pot rbs area shown below is 'too obvious?'
{quote} Hi. Yeh, - a perhaps growing pattern of 1hr bullish hidden div is already present - could stay good whilst price above 2596. I wonder though, if tested, whether that 4hr pot rbs area shown below is 'too obvious?' 4hr below {image}
Ignored
Beside looking at the chart for clues, im trying to understand that during consolidation, whether MM or IT are accumulating (buying quietly) or distributing (selling quietly).
Hard question for me as newbie to answer.
When the market has low volatility, prices move within a narrow range.
This can happen when buyers and sellers are in balance (e.g., consolidation).
However, is it possible to analyze it using volume, price action, and Wyckoff Theory ?
1. Clues from Volume & Price Action
Accumulation (Smart Money Buying)
Price moves in a tight range, forming a base.
Volume spikes on up moves, but price doesn’t break out yet (hidden buying).
Down moves have lower volume, showinglack of aggressive selling.
False breakdowns (spring):
Price dips below support but quickly recovers, trapping sellers.
Distribution (Smart Money Selling)
Price moves in a range, but the up moves look weak.
Volume spikes on up moves but lacks strong follow-through.
Down moves start to show increasing volume, signaling selling pressure.
False breakouts (upthrusts): Price pushes above resistance but quickly reverses, trapping buyers.
2. Wyckoff Method for Confirmation
Accumulation: Look for higher lows, fake breakdowns, and volume picking up on up moves.
Distribution: Look for lower highs, fake breakouts, and volume picking up on down moves.
3. Smart Money Footprint (Order Flow & Market Profile) If big orders sit at support → likely accumulation. If big orders sit at resistance → likely distribution.
Delta (net buy vs. sell volume) can confirm buying or selling pressure.
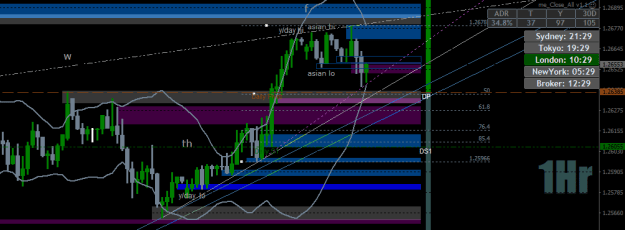
...funny how these ranges can exercise some kinda gravitational/magnetic pull on price. this aforesaid mini 15min/30min/1hr example - bordered by the asian hi and lo, is again being tested @ it's lo (asian lo,) this after a 2nd downside b/o to 30min t/f has met demand below it again.
...funny how these ranges can exercise some kinda gravitational/magnetic pull on price. this aforesaid mini 15min/30min/1hr example - bordered by the asian hi and lo, is again being tested @ it's lo (asian lo,) this after a 2nd downside b/o to 30min t/f has met demand below it again. {image}
Ignored
Interesting how MissD and her Gold analysis / trading appears to be fairly closely aligned to your own..
The first time I have seen this type of alignment with your trading style.
{quote} Beside looking at the chart for clues, im trying to understand that during consolidation, whether MM or IT are accumulating (buying quietly) or distributing (selling quietly)...
Ignored
Yeh, I think we all to struggle with that. What I have generally observed is this;
1. When the market is trending consolidation tends ultimately to be followed by more with trend movement 2. The market may break the other end of the range to pick up liquidity to continue in trend direction. 3. A 1st b/o of the range/consolidation in either direction is generally false, and the 2nd or subsequent b/o in same direction (if that is what happens) tends to be truer.
Other than that, I just play my repeating set-ups within the context of range or trend on the t/f's I operate on, and what will happen will happen
------------------------------------------------------------------------------------------------------------------------------------------------------------------
{quote} Interesting how MissD and her Gold analysis / trading appears to be fairly closely aligned to your own.. The first time I have seen this type of alignment with your trading style.
Ignored
Hi. Thanks. I never seen any of her posts, will take a look though.
... 1hr right now looks much like 4hr recent PA. Ie; an upside b/o of something (4hr = last wk's hi, 1hr = y/day hi,) then another, and another @ slightly higher highs, but not much above it, then @ the final upside b/o hi - a drop-down below the other side of the recent ranginess on the t/f, which on 4hr was followed by a move up from there to decisive new highs. Will this repeat on 1hr now?