GBPUSD Weekly Technical Outlook
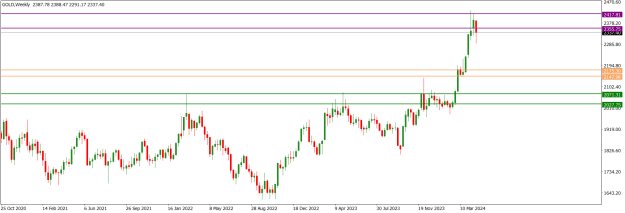
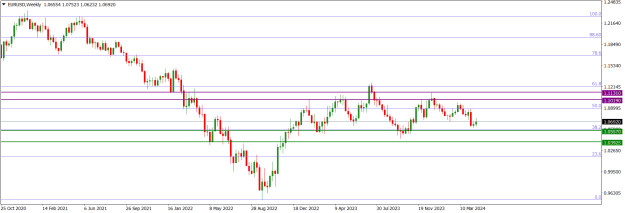
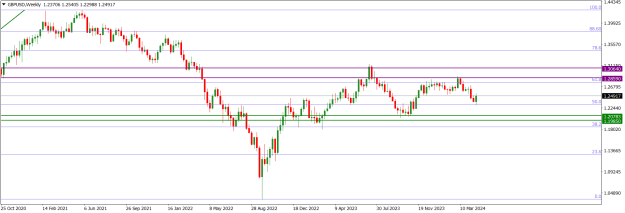
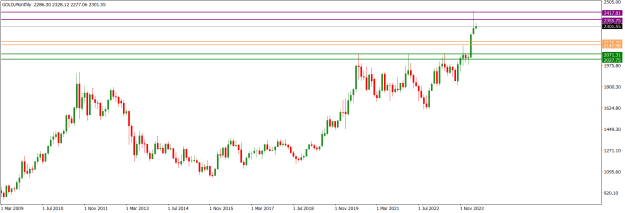
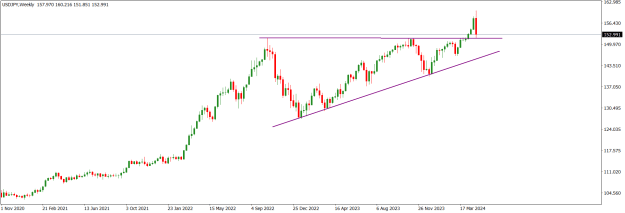
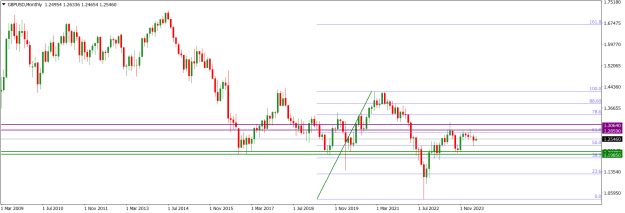
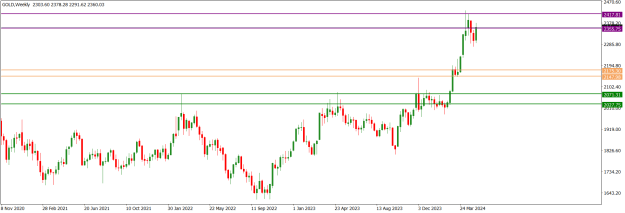
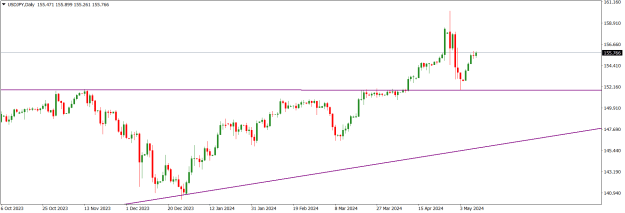
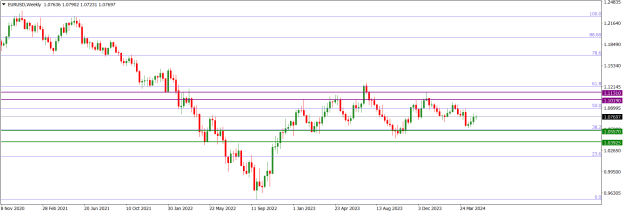
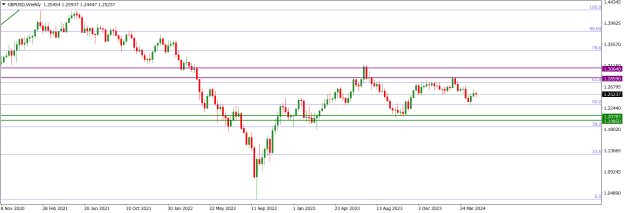
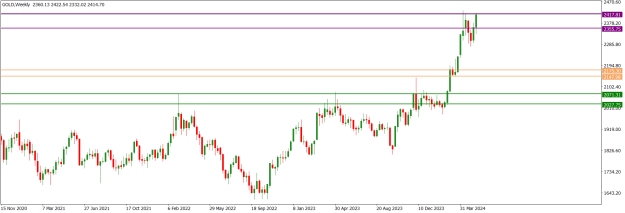
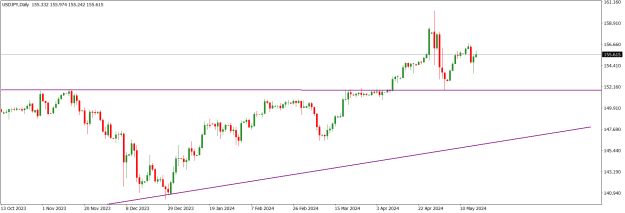
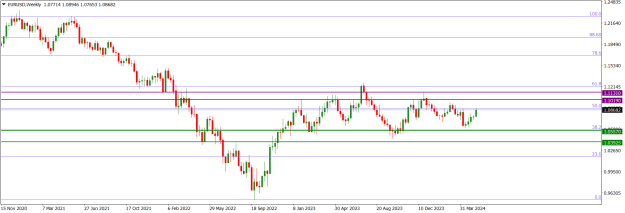
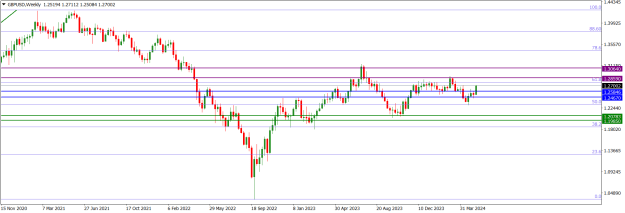
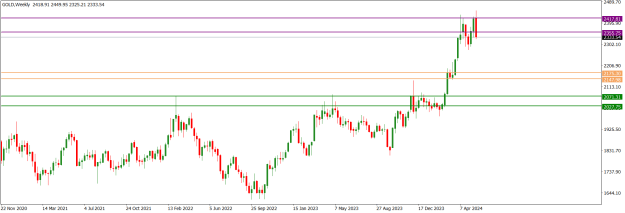
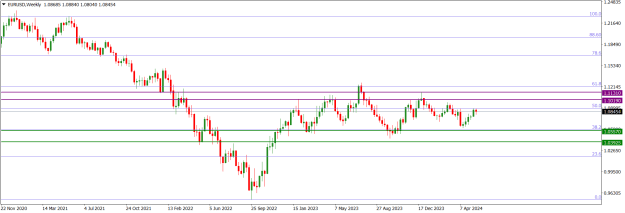
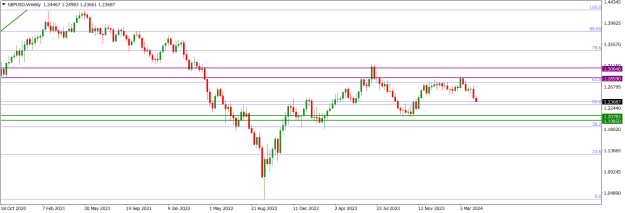
GBPUSD market operation on the weekly time frame is bearish. However, there is a decline in bearish momentum. Last week, market operation printed a relatively smaller bearish candlestick than the one printed in the previous week. Presently, market operation is located at the 1.23687 horizontal support area, which aligns with the 50 Fib retracement area of the bearish swing that began in late May 2021.
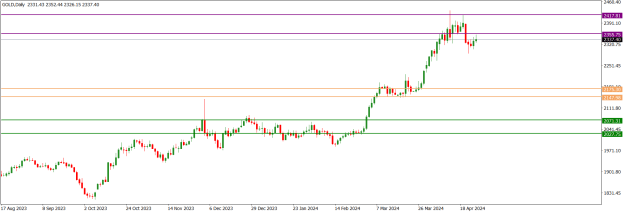
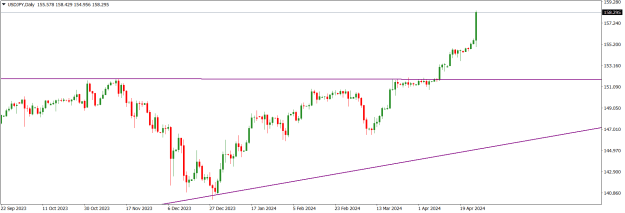
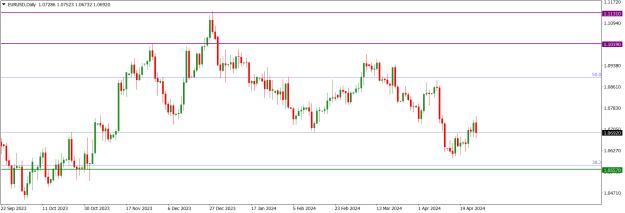
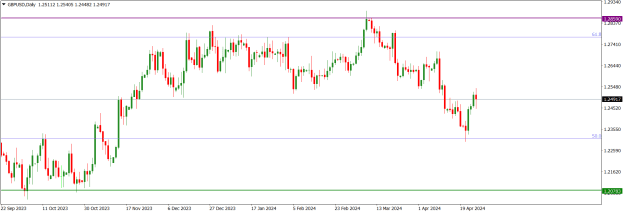
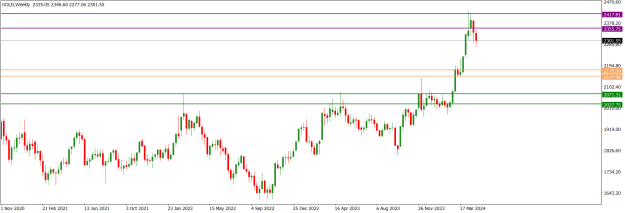
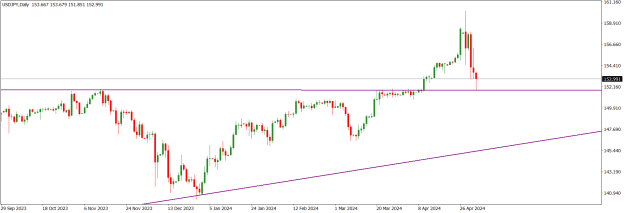
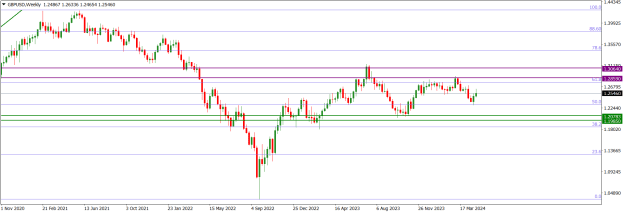
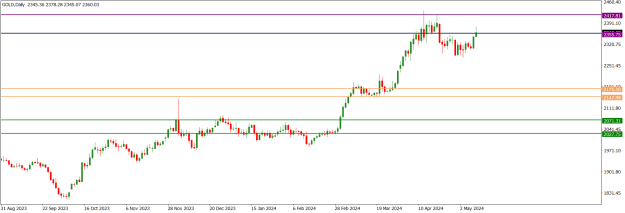
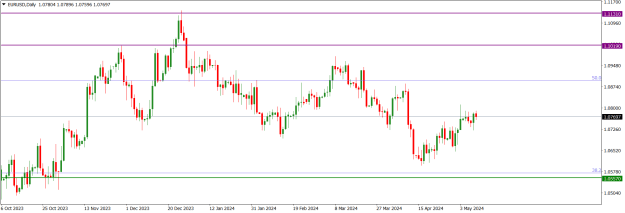
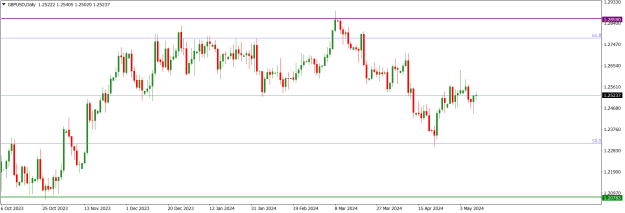
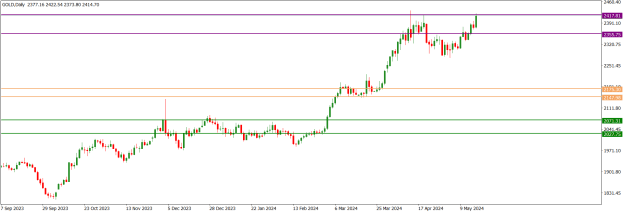
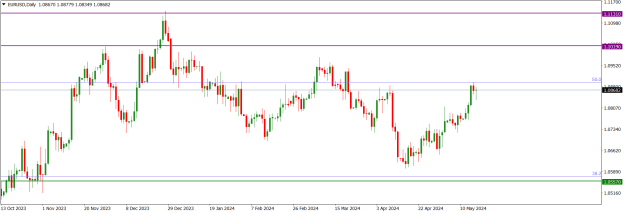
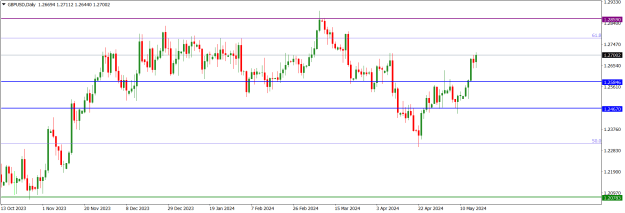
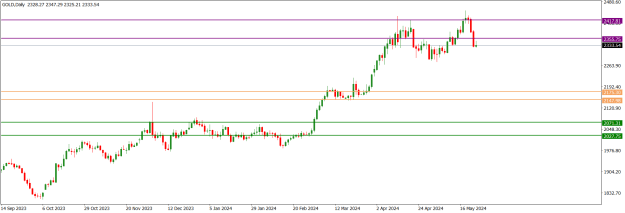
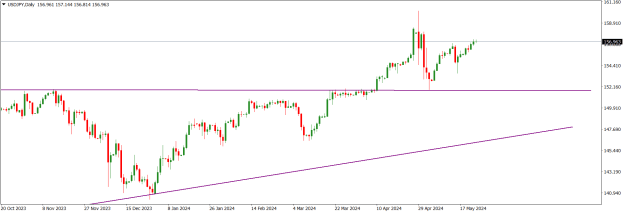
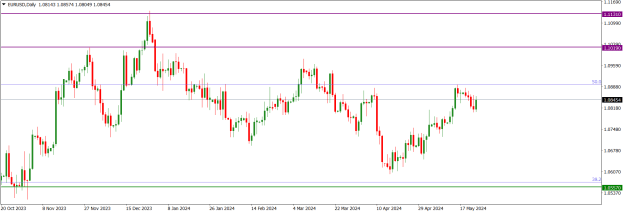
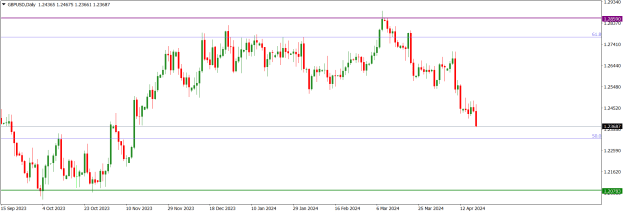
GBPUSD price action on the daily time frame is bearish. Presently, price action is tackling the 1.236887 horizontal support area. The dominant technical structure is bearish.
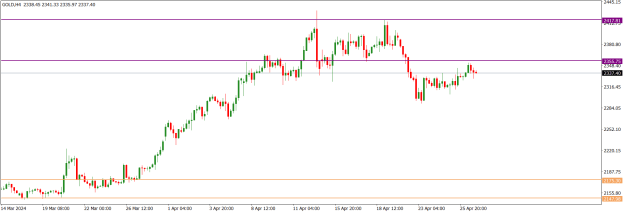
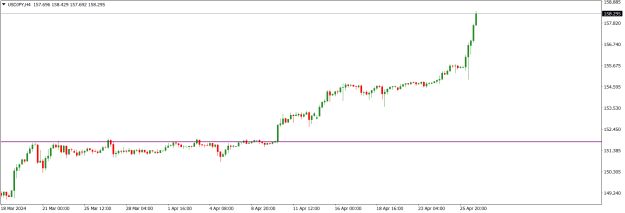
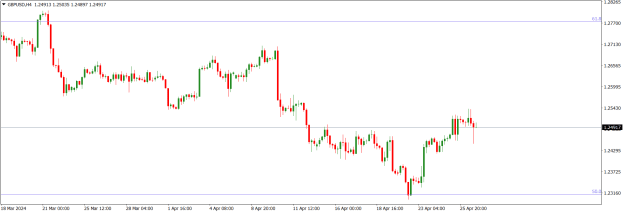
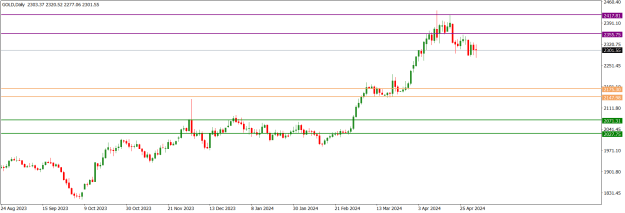
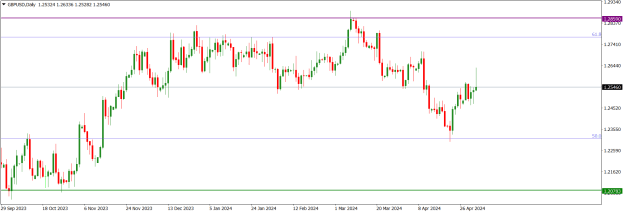
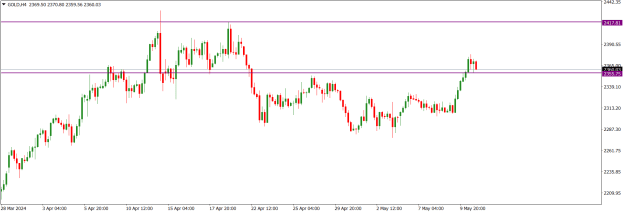
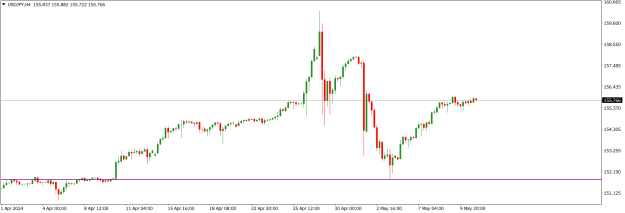
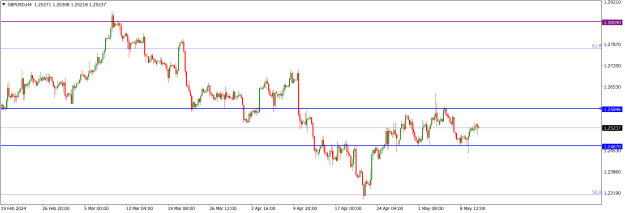
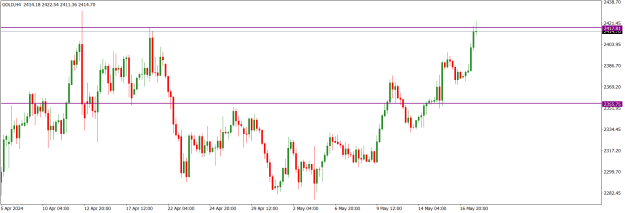
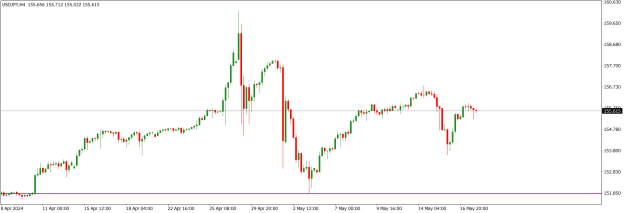
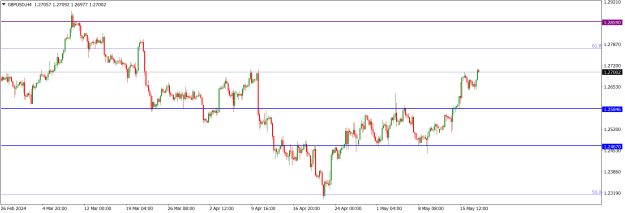
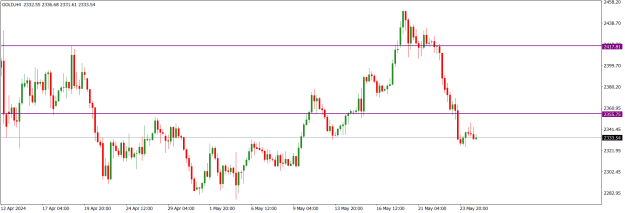
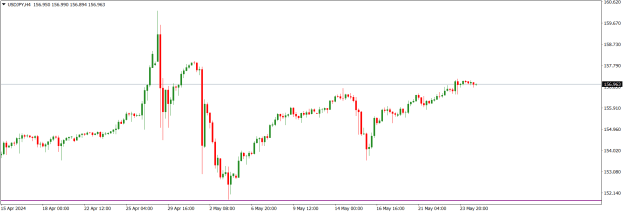
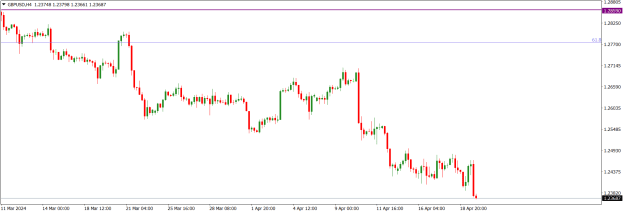
GBPUSD price action on the H4 time frame is bearish but the bearish momentum has decreased as price action tackles the 1.236887 horizontal support area. The dominant technical structure is bearish.
I may be wrong. Trade safe and prosper.
KP
GBPUSD market operation on the weekly time frame is bearish. However, there is a decline in bearish momentum. Last week, market operation printed a relatively smaller bearish candlestick than the one printed in the previous week. Presently, market operation is located at the 1.23687 horizontal support area, which aligns with the 50 Fib retracement area of the bearish swing that began in late May 2021.
Attached Image (click to enlarge)
GBPUSD price action on the daily time frame is bearish. Presently, price action is tackling the 1.236887 horizontal support area. The dominant technical structure is bearish.
Attached Image (click to enlarge)
GBPUSD price action on the H4 time frame is bearish but the bearish momentum has decreased as price action tackles the 1.236887 horizontal support area. The dominant technical structure is bearish.
Attached Image (click to enlarge)
I may be wrong. Trade safe and prosper.
KP
Do your homework, follow the footprints of smart money