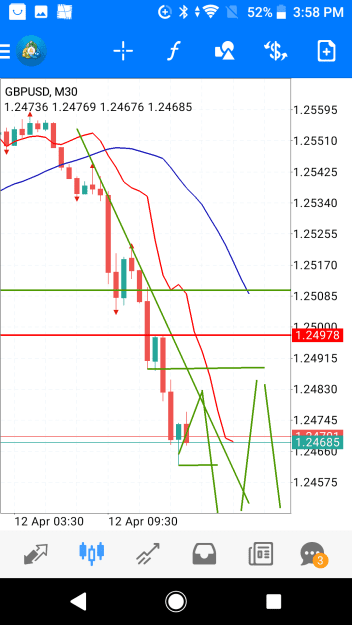
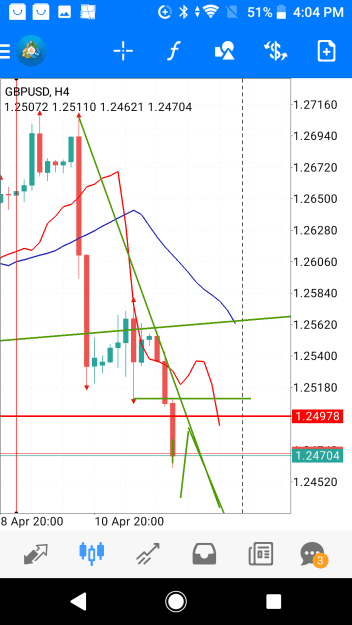
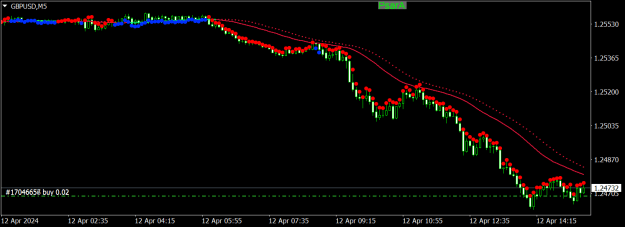
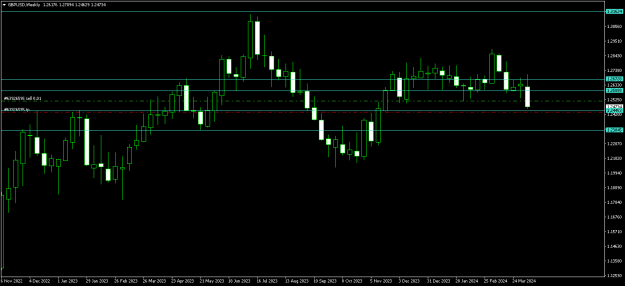
Disliked{quote} this was my logic trumps the top chart is the weekly I posted earlier today saying price is entering a support area and I went long on an hourly buy signal the other other chart is a 5min with the same lines and there's the bounce that gave me the signal which I took and price kept falling to that lower line I haven't bought again so even tho I'm 50 pips underwater I'm not hurting since it was my first and only long so far...ill prolly cancel my buy stop since it didn't trigger and manually buy and my average will drop down now since I think...Ignored
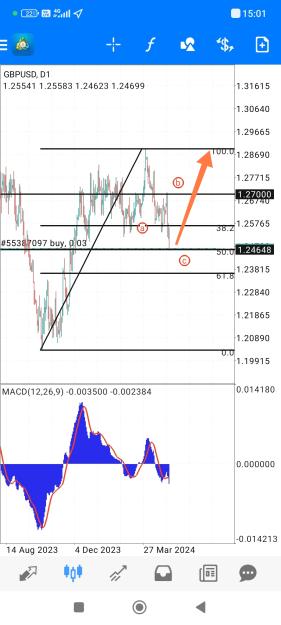
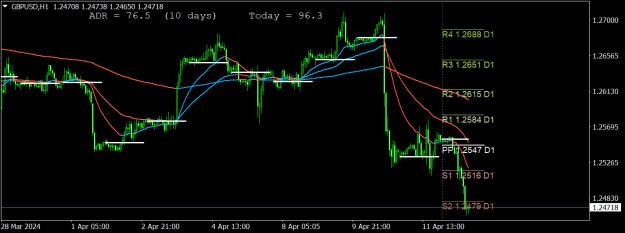
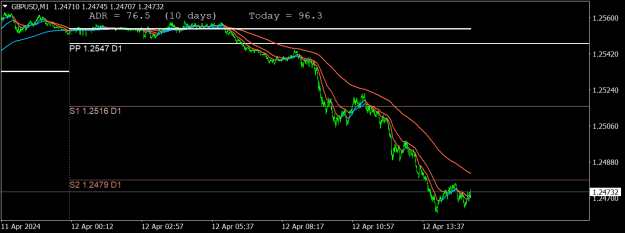
yes I get you, personally I think it can bounce back to 2588 before meandering south again.
That's ok by me, as I don't have the time to watch 1 or 4hr charts, (or 5mins
I used to watch 1 hour and the 4hr at most, but that was when I had more time on my hands.
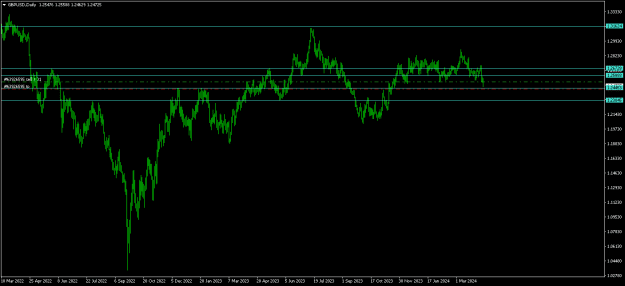
The Daily is now the lowest I can analyse.
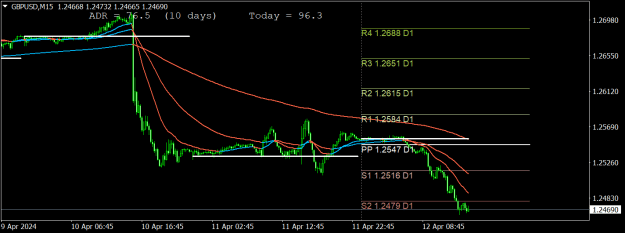
I got these levels below, but you are right, since I prefer swing trades, it can go up and down and give us both what we are looking for.
Attached Image(s) (click to enlarge)
Compulsions can be hard to resist