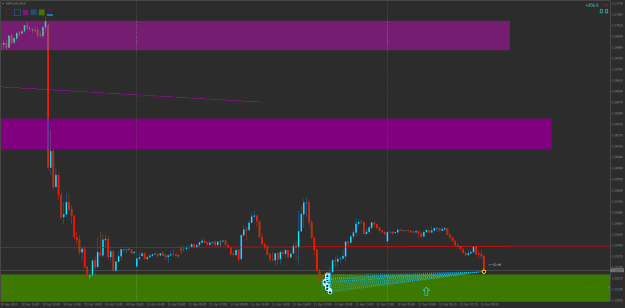
Daily line chart
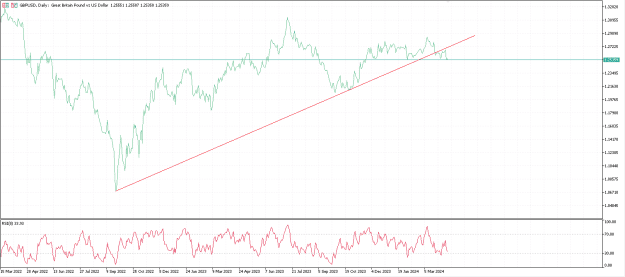
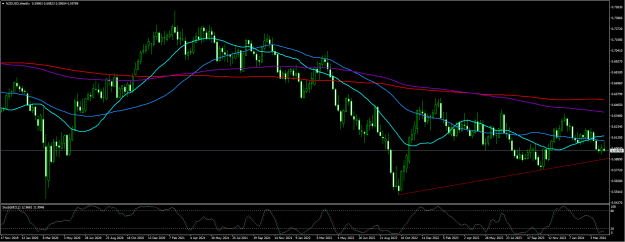
Seen in candles

I don't mean we go straight down, but really things are quite different now compared to February when the 1.25 supported the price since still within an uptrend.
My question is: what could be the trigger to send price back up?
We probably see some bounces around this area but even the 1.26 now seems quite far.
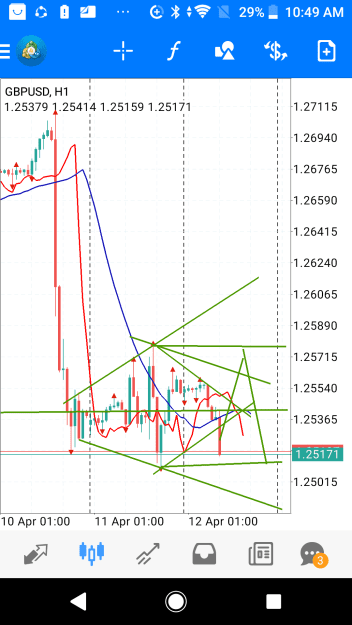
Attached Image (click to enlarge)
Seen in candles
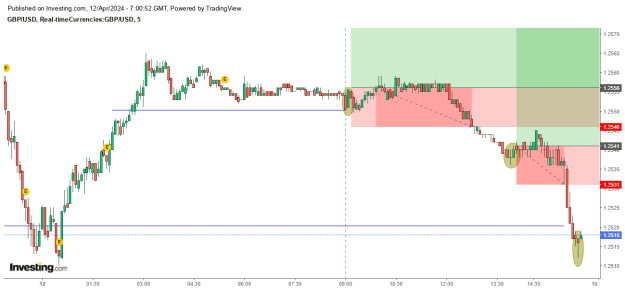
Attached Image (click to enlarge)
I don't mean we go straight down, but really things are quite different now compared to February when the 1.25 supported the price since still within an uptrend.
My question is: what could be the trigger to send price back up?
We probably see some bounces around this area but even the 1.26 now seems quite far.
90% of traders use TA, indicators and prediction
2