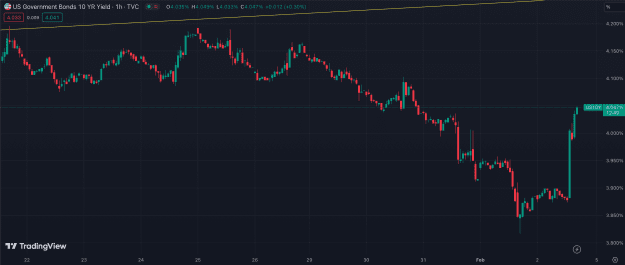
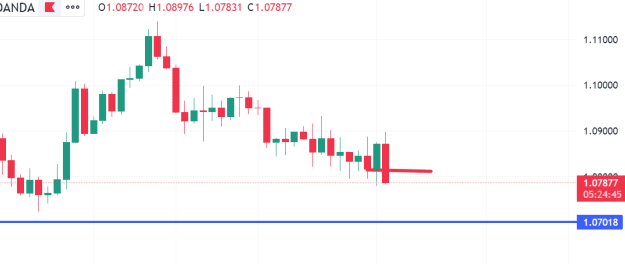
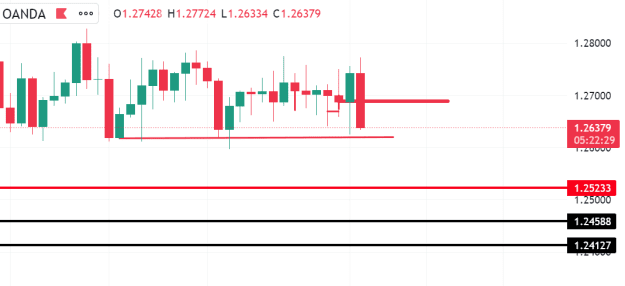
here are my EU and GU charts...a close under those thick lines means we should keep falling next week
now remember these are daily charts so monday or tuesday price might climb up to retest those lines and im sure the bools will pull out stupid targets out of their asses since they wont be grounded in reality LOL and then start falling again wed,thur, and fri
thats how price and the market works...just because a hourly or daily candle closes green or red doesnt mean its bullish or bearish in and of itself ... thats why i shorted yesterdays big green candles ...its the relationship of the 2 or three candles...i dont mean patterns i mean the last 2 or 3 candles and how they look to each other....you know tape reading...look it up in google
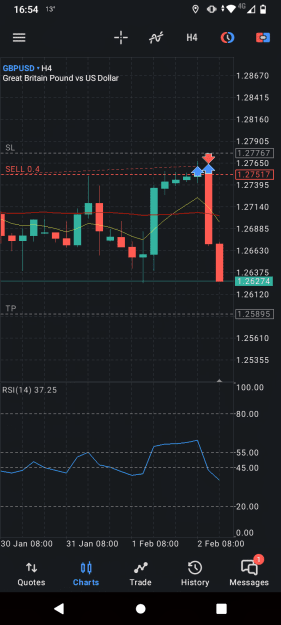
ill stay bearish GU till price falls to those 2 black lines...i explained them like 4 weeks ago when i first turned bearish....if you want to know why i made those lines youll have to search for that post
now remember these are daily charts so monday or tuesday price might climb up to retest those lines and im sure the bools will pull out stupid targets out of their asses since they wont be grounded in reality LOL and then start falling again wed,thur, and fri
thats how price and the market works...just because a hourly or daily candle closes green or red doesnt mean its bullish or bearish in and of itself ... thats why i shorted yesterdays big green candles ...its the relationship of the 2 or three candles...i dont mean patterns i mean the last 2 or 3 candles and how they look to each other....you know tape reading
ill stay bearish GU till price falls to those 2 black lines...i explained them like 4 weeks ago when i first turned bearish....if you want to know why i made those lines youll have to search for that post
Attached Image(s) (click to enlarge)
short trump and go long the deepstate
1