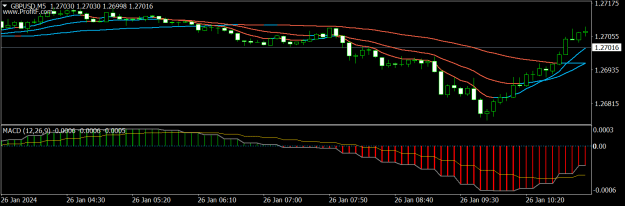
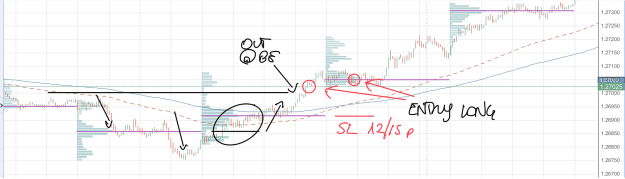
Disliked{quote} well, I started my trading experience with Moving Averages. Then after some years I did not use them anymore. Lately, looking for something additional to filter entries, I started using them again in faster timeframes. The real problem about moving averages is that they , same as all indicators, tells you what happened until that moment, but they don't tell you wher is better enter or exit a trade. And when they do, that's because, by chance, the line comes closed to important S/R levels. So I came to a simple conclusion: 1. I need them...Ignored
Attached Image (click to enlarge)
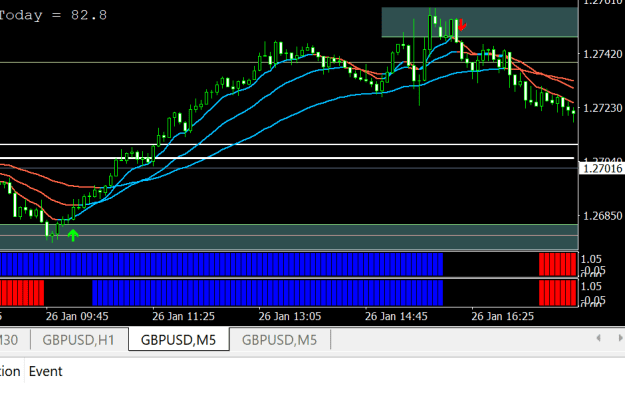
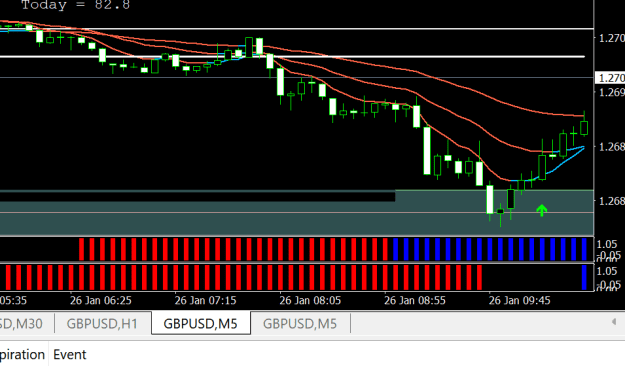
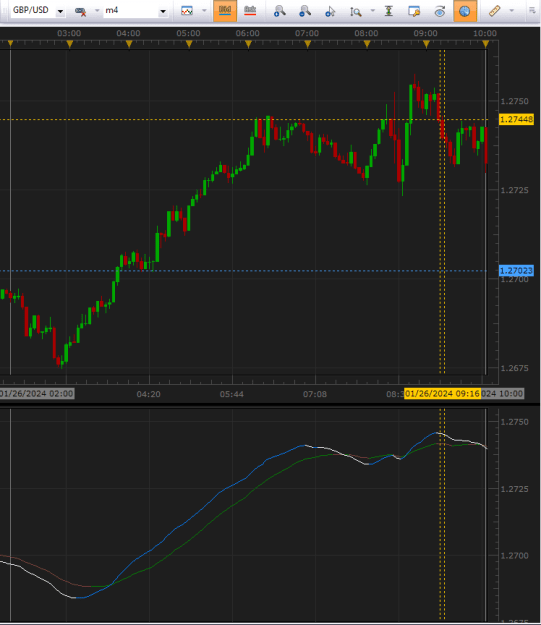
Intraday only.
1
1