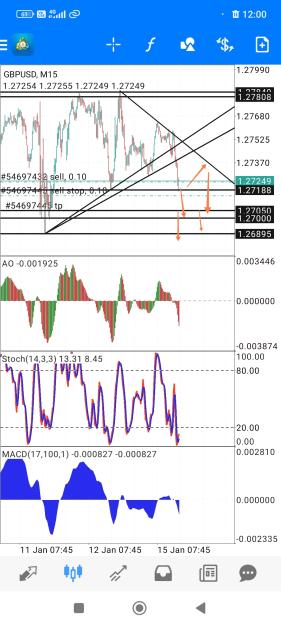
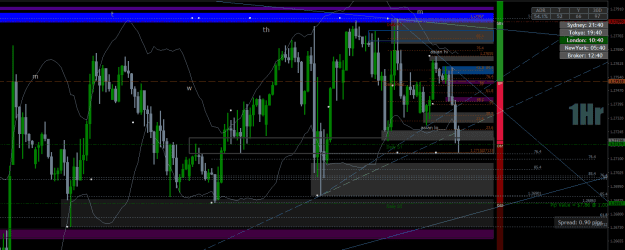
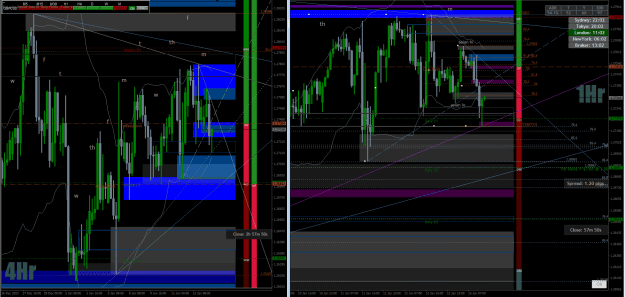
...you can see the attempt on the 4hr part of that wide prev 1hr/4hr sw hi zone = prev res = pot res (@ the Asian/current dly hi,) that extends to last wk's 2785 circled in red on chart below. Lower white circle are prev sw lo zones (coexistent with each other) where demand might emerge if tested? It's a scenario, but never guaranteed.
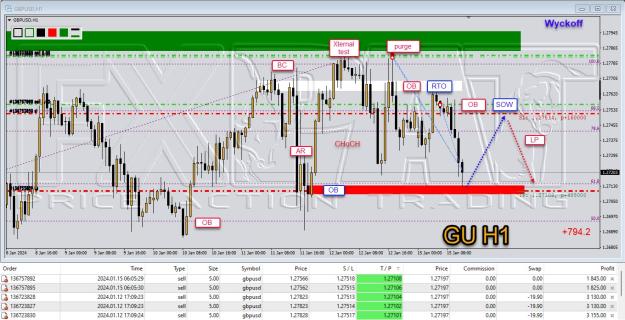
4hr with 10/20/40 ema crosses graphic below
4hr with 10/20/40 ema crosses graphic below
Attached Image (click to enlarge)

Trader with an Edge.
3