Disliked{quote} Hi O, You posted that on the other thread days ago. How do we apply that with our retail context? Demonstration possibility allowance for us by you coming?Ignored
eg in 2nd equation. to subtract time horizon means you speed up time or slow it down. this not about time of day. wasteful to use that coz new minute can be changed or manipulated from last. false feeling of security comes from these assumptions. large positions can give halt to movement but they cant speed up or slow down time. why not. they now have most using same tech view. if digital then same engine with different shell.
productivity is needed for all markets. if no productivity then all stop and life stops. so a simple demonstration. find a site on chart where movement stopped fast then price was recalled back to previous locations. now do same for where movement did same thing but slow on this choice. now ask what is brother and sister. why related. now look at chart where u chose movements for tis demo. problem to face. some people want outcomes but refuse to change. so want outweigh or overule what right in front of eyes.
equations are testimony to eyes and brain together. not want. data sources can be from well reported realistic engrained places. so cnn not one. 3rd party data providers no too. why. dont give you full license to learn. just bundles of data that you must manipulate so then makes sense. eg of place. branches of society that seek to report changes not gossip or raw bundling. eg categories of industry finance etc.
results of equation gives reading of timed account of data. eg data processed thry equation daily. daily is simple to help see deviations. this why algo people not so smart. they driven by profit not looking. each equation give view. as view changes then position is used to look. once 3 reasons are applied to position then easier to view participants in any instrument at any time. but beginners cant know this coz they do what others around them do not know better.
Attached Image (click to enlarge)
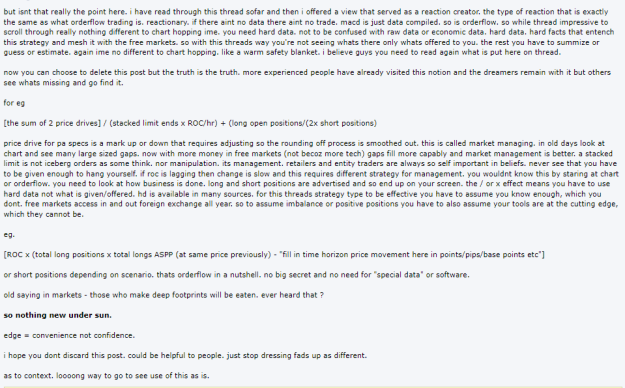
wen you know that data engine nexus is same watever charting you use or data you use then easy to know how to not do it. now you can practice using equational application not data positions and guessing. people assume chart is benchmark standard for readout. that why some unhappy so they seek other data. but other data is same species of previous used data so really not different. may have a bit overlap but never complete and never owned by operator. equations are way to set standard so easier to look and see positions. stacked limits are based on real reporting not sideline data eg injected orderflow etc. using a spreadsheet is recommended for use of equations. rest is unbiased market knowledge accumulation.
have fun.
O.
protein for breakfast !