People don't plan to lose. They lose because they don't plan.
 Cable Update (GBPUSD)

- #781,263
- Oct 7, 2023 3:40am Oct 7, 2023 3:40am
- Joined Aug 2010 | Status: absolute beginner | 5,464 Posts
trading is like dancing, don't think and just listen to the music!
- #781,264
- Oct 7, 2023 4:04am Oct 7, 2023 4:04am
- Joined May 2020 | Status: Best trader ever to exist ever | 10,711 Posts
- #781,265
- Edited 7:49am Oct 7, 2023 5:04am | Edited 7:49am
- Joined Oct 2020 | Status: couldn't give a flying duck | 7,388 Posts
- #781,266
- Oct 7, 2023 6:14am Oct 7, 2023 6:14am
- Joined Sep 2022 | Status: Trader | 2,296 Posts
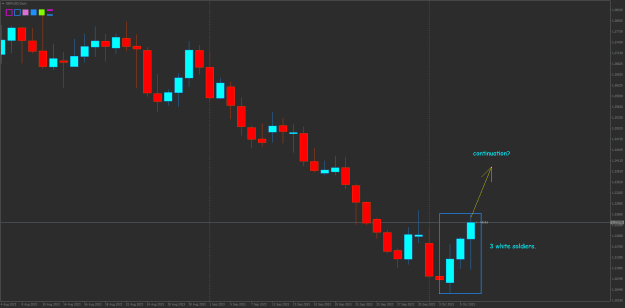
Exhausted 
- #781,267
- Oct 7, 2023 6:17am Oct 7, 2023 6:17am
- Joined Sep 2022 | Status: Trader | 2,296 Posts
Exhausted
- #781,270
- Edited 10:44am Oct 7, 2023 6:55am | Edited 10:44am
- Joined Apr 2020 | Status: Trader | 8,809 Posts
Trader with an Edge.
- #781,271
- Oct 7, 2023 7:34am Oct 7, 2023 7:34am
- Joined Aug 2010 | Status: absolute beginner | 5,464 Posts
trading is like dancing, don't think and just listen to the music!
- #781,273
- Oct 7, 2023 7:51am Oct 7, 2023 7:51am
- Joined Oct 2020 | Status: couldn't give a flying duck | 7,388 Posts
- #781,274
- Oct 7, 2023 8:33am Oct 7, 2023 8:33am
- Joined Nov 2007 | Status: left CanaryWharf desk-tea break | 24,286 Posts
On-site guru & also FF member's' psychiatrist, when not drinking tea
- #781,278
- Edited 10:42am Oct 7, 2023 10:26am | Edited 10:42am
- Joined May 2022 | Status: Trader | 8,180 Posts

short trump and go long the deepstate
- #781,279
- Edited 10:51am Oct 7, 2023 10:37am | Edited 10:51am
- Joined Apr 2020 | Status: Trader | 8,809 Posts
Trader with an Edge.
- #781,280
- Oct 7, 2023 10:39am Oct 7, 2023 10:39am
- Joined May 2022 | Status: Trader | 8,180 Posts
short trump and go long the deepstate