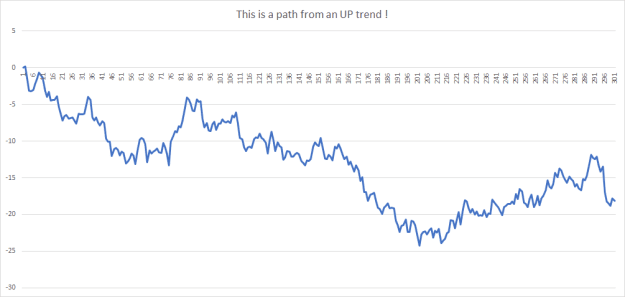
Disliked2. Skew is going to manifest itself in long leads. This doesn’t mean it’s actually real. Think of Brownian motion drawn with coin flips. The results have long leads, meaning it rarely even ends where it started, and will spend most of its time “trending” one way or the other, ending above/below where it started. when you look at the paths in isolation, they all have skew one way or the other, but in aggregation, we know there is no actual skew in the data, and all the observable skew on any one path is cancelled out by the other paths that skewed...Ignored
Attached Image (click to enlarge)
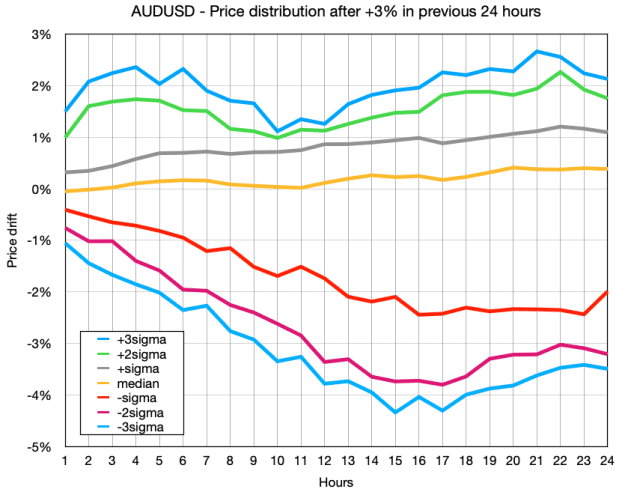
That seems to suggest price is indeed mean reverting! However, price rarely moves +3% in 1 day. It happened only 73 times in the last 4 years, so the above is based on only 1893 M1 bars.
Let's look at the price drift after a -2% change in the previous 24 hours (which happened 625 times in the last 4 years, giving 11696 M1 bars):
Attached Image (click to enlarge)
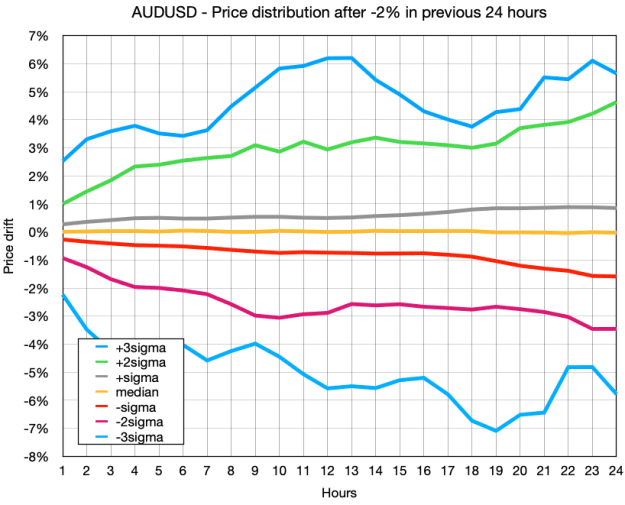
Interesting! Now there doesn't seem to be mean reversion, however, the cones are much wider suggesting after a -2% change the volatility of the markets remains a bit higher than usual...
2