• Home
  • Forums
  • Trades
  • News
  • Calendar
  • Market
  • Brokers
  • Login
  • Join
  • 6:33am
Menu
  • Forums
  • Trades
  • News
  • Calendar
  • Market
  • Brokers
  • Login
  • Join
  • 6:33am
Sister Sites
  • Metals Mine
  • Energy EXCH
  • Crypto Craft

Options

Bookmark Thread

First Page First Unread Last Page Last Post

Print Thread

Similar Threads

Simple Mean Reversion 619 replies

Pairs Trading: Reversion to the Mean 22 replies

Forward test of my new mean reversion strategy 11 replies

Question for synthetic and non-synthetic currency pairs 0 replies

Cointegration, Synthetic hedges, mean reversion in R, Tech Thread 0 replies

  • Trading Discussion
  • /
  • Reply to Thread
  • Subscribe
  • 91
Attachments: Synthetic hedges, cointegration, mean reversion and similar stuff
Exit Attachments
Tags: Synthetic hedges, cointegration, mean reversion and similar stuff
Cancel

Synthetic hedges, cointegration, mean reversion and similar stuff

  • Last Post
  •  
  • Page 1 23456 21
  • Page 1 234 21
  •  
  • Post #1
  • Quote
  • First Post: Edited Oct 28, 2010 9:21am Oct 27, 2010 8:55pm | Edited Oct 28, 2010 9:21am
  •  7bit
  • Joined Mar 2009 | Status: Member | 1,231 Posts
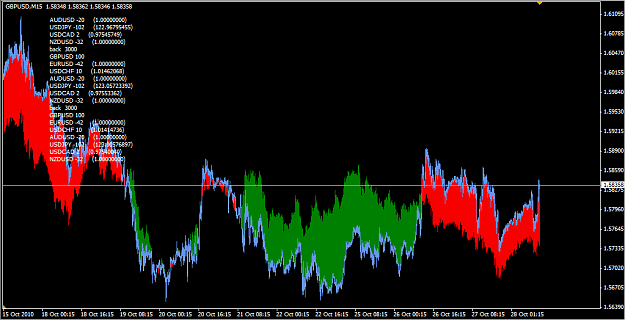
Has anybody successfully (with profit) tried to trade things like this:

Attached Image (click to enlarge)
Click to Enlarge

Name: 2010-10-28-024639_898x522_scrot.png
Size: 28 KB


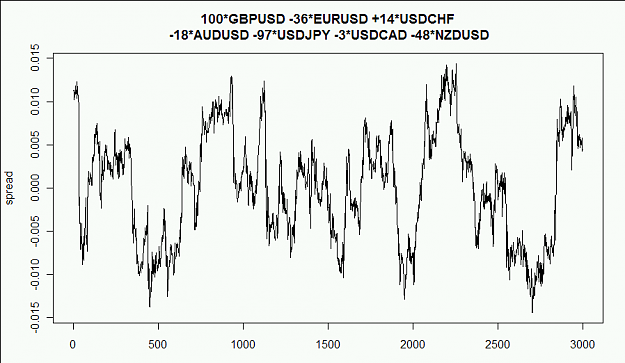
I have opened a demo short on the above synthetic instrument (each point is an M15 candle, the numbers should 1:1 translate to oanda units if I didn't get the calculation wrong!¹) to see how this behaves. It seems I can always find such nicely ranging combinations with a simple linear regression. The question is only: will it move through the range one more time or will it explode now because I have seen it?

______
¹) [edit:] The numbers are indeed wrong.
  • Post #2
  • Quote
  • Oct 28, 2010 1:15am Oct 28, 2010 1:15am
  •  Darkstar
  • | Membership Revoked | Joined Nov 2005 | 1,429 Posts
Over a long enough timeline, it can definitly be done. After all, currencies in general are quite susceptable to mean reversion. This doesn't mean, however, that you can just run wild when it gets to the top or bottom of the range. Things can and do change over time and if your only metric for determining a good trade opportunity is a function of standard deviation, your going to someday have your ass handed to you.

Before you get too deep into this type of research, it would behoove you to read up on the story of Long Term Capital Management. They did a great deal of work with stat arb concepts, which are very similar to what your talking about. If nothing else it will enlighten you with regard to the risks inherent in the strategy.

Luck be with you.
 
 
  • Post #3
  • Quote
  • Oct 28, 2010 2:19am Oct 28, 2010 2:19am
  •  Craig
  • Joined Feb 2006 | Status: Blah blah blah | 1,410 Posts
Plenty of people make this type of stuff work, however, I don't know of anyone doing this type of thing with forex. There are also many ways of doing it, if you have access to any academic databases you can dig around for some of the other techniques in this field. One simple exercise you could do is to 'walk forward' your spread, see how it holds up OOS. Spreads like this are the basic bread & butter for many traders.
The breaking of a wave cannot explain the whole sea.
 
 
  • Post #4
  • Quote
  • Oct 28, 2010 4:02am Oct 28, 2010 4:02am
  •  mbkennel
  • Joined Nov 2009 | Status: Member | 245 Posts
Try the fit using
(a) logarithms of price.
(b) differing time intervals (or decaying kernels) weighting them.

Do you have code for this publicly available?

I think the real issue is having some idea when an apparent excursion isn't going to come back. If you see a fluctuation in a 'normal' time period, then go for it---but if you see something blow out immediately after a major news release, then it's probably a good idea to wait. The underlying dynamics and beliefs of the traders may have changed as a consequence.
 
 
  • Post #5
  • Quote
  • Oct 28, 2010 4:43am Oct 28, 2010 4:43am
  •  Adal
  • Joined Mar 2009 | Status: Member | 770 Posts
I hope that this particular range that you found is much larger than 3000 points. It looks like you would have around 10 mean-reversion trades in this range, but you have 14 fitting parameters (100, -36, 14, -18, ..., GBP/USD, EUR/USD, ...)

If this is not overfitting, I don't know what is :-p

Have you checked if the gain from the trades are above transaction cost? Some of the pairs can have large spreads, and you must also factor in much larger possible slippage when trying to put on a multi-legged position like this.

BTW, I'm also working on this kind of stuff.
 
 
  • Post #6
  • Quote
  • Oct 28, 2010 4:50am Oct 28, 2010 4:50am
  •  7bit
  • Joined Mar 2009 | Status: Member | 1,231 Posts
Quoting mbkennel
Disliked
Try the fit using
Do you have code for this publicly available?
Ignored
Its just a few lines of R code. I have only recently started experimenting with R after I made my mql4->R interface library work and this one was one of the first experiments to test it. The code basically does the following: I have create a matrix where each column is a series of close prices. The first one is the currency pair for which I try to find a hedge (in the above case GBPUSD). Then I do the following:

this <- data[,1];
others <- data[,-1];
model <- lm(this ~ others + 0);
pred <- as.vector(predict(model));
spread <- this - pred;
plot(spread)

then I multiply each coefficient of the model with MODE_LOTSIZE * MODE_TICKSIZE * MODE_TICKVALUE to get the needed oanda units (I'm not yet sure whether this last part of the calculation is correct, it might also be completely wrong).
 
 
  • Post #7
  • Quote
  • Oct 28, 2010 5:03am Oct 28, 2010 5:03am
  •  7bit
  • Joined Mar 2009 | Status: Member | 1,231 Posts
Quoting Adal
Disliked
Have you checked if the gain from the trades are above transaction cost?
Ignored
It should be (theoretically), it should translate into 200 pips GU against the others if I am not completely mistaken, I can also plot it into the GU chart in MT4 itself. I did not yet do much testing yet. I made this plot yesterday evening and now I am going to explore the possibilities.
 
 
  • Post #8
  • Quote
  • Edited 6:04am Oct 28, 2010 5:49am | Edited 6:04am
  •  7bit
  • Joined Mar 2009 | Status: Member | 1,231 Posts
This is how it looks like when plotting the predicted (the other side of the hedge) into the GBPUSD chart:

Attached Image (click to enlarge)
Click to Enlarge

Name: 2010-10-28-114709_1023x524_scrot.png
Size: 65 KB

Attached Image (click to enlarge)
Click to Enlarge

Name: 2010-10-28-120307_1023x523_scrot.png
Size: 70 KB
 
 
  • Post #9
  • Quote
  • Oct 28, 2010 6:20am Oct 28, 2010 6:20am
  •  7bit
  • Joined Mar 2009 | Status: Member | 1,231 Posts
If I run this script every day it will always give me slightly different coefficients.

Now I have this other crazy idea in my mind: What about a "soft" stop-loss: If it starts moving out of the range and the regression slowly comes up with slightly different coefficients to make it fit into a (new) range again I change all the position sizes accordingly to meet the new requirements instead of just closing all trades.

For example if only the USDJPY part suddenly starts behaving "wrong" it would reduce its coefficient to minimize the effect and increase/adjust others until it fits inside a range again. I would then reduce my exposure to USDJPY (it would be on the losing side by definition and it would make me slowly scale out of the parts that started losing over-proportional) and increase/adjust the others and continue waiting instead of closing them all.
 
 
  • Post #10
  • Quote
  • Edited 8:01am Oct 28, 2010 7:46am | Edited 8:01am
  •  7bit
  • Joined Mar 2009 | Status: Member | 1,231 Posts
It seems I can even make nice trends, even nicer than the ranges:

Attached Image (click to enlarge)
Click to Enlarge

Name: 2010-10-28-133924_1023x633_scrot.png
Size: 88 KB


This are H4 candles starting in march 2009 until today. The signs are wrong! minus is plus and plus is minus! (And the lot sizing factors might still be completely wrong).

I simply made:

this <- seq(1, back)/back;
model <- lm(this ~ data + 0);

"data" is the matrix of close prices as mentioned before and "this" is a straight line from 0 to 10000 pips.
 
 
  • Post #11
  • Quote
  • Oct 28, 2010 9:09am Oct 28, 2010 9:09am
  •  7bit
  • Joined Mar 2009 | Status: Member | 1,231 Posts
LOL! Whenever I enter a range the price will immediately leave it. (Law of Murphy):
Attached Image


BTW: The factors have changed. The calculation was wrong. Also I have changed the call to lm() to allow it to calculate an intercept. I don't see why it should not be allowed to have an intercept in the model.

Please some mathematician tell me that this is correct or convince me that I'm wrong.
 
1
  • Post #12
  • Quote
  • Oct 28, 2010 9:50am Oct 28, 2010 9:50am
  •  Adal
  • Joined Mar 2009 | Status: Member | 770 Posts
Quoting 7bit
Disliked
I don't see why it should not be allowed to have an intercept in the model.

Please some mathematician tell me that this is correct or convince me that I'm wrong.
Ignored
You'll have better luck here: http://stats.stackexchange.com
 
 
  • Post #13
  • Quote
  • Oct 28, 2010 11:24am Oct 28, 2010 11:24am
  •  qwerty777
  • | Joined Oct 2008 | Status: Member | 40 Posts
Quoting 7bit
Disliked
This is how it looks like when plotting the predicted (the other side of the hedge) into the GBPUSD chart:

Attachment 569353
Attachment 569363
Ignored
Post your indy plz.
 
 
  • Post #14
  • Quote
  • Oct 28, 2010 1:24pm Oct 28, 2010 1:24pm
  •  Craig
  • Joined Feb 2006 | Status: Blah blah blah | 1,410 Posts
Quoting 7bit
Disliked
The calculation was wrong. Also I have changed the call to lm() to allow it to calculate an intercept. I don't see why it should not be allowed to have an intercept in the model.
Ignored
Err..huh? Are you trying to ask why a linear regression needs an intercept?
The breaking of a wave cannot explain the whole sea.
 
 
  • Post #15
  • Quote
  • Oct 28, 2010 1:30pm Oct 28, 2010 1:30pm
  •  2+2=4ex
  • Joined Mar 2009 | Status: Trader | 6,418 Posts
Wish I could understand this, but I'm terrible at math.
 
 
  • Post #16
  • Quote
  • Edited 3:38pm Oct 28, 2010 3:25pm | Edited 3:38pm
  •  7bit
  • Joined Mar 2009 | Status: Member | 1,231 Posts
Quoting Craig
Disliked
Err..huh? Are you trying to ask why a linear regression needs an intercept?
Ignored
by calling it this way

lm(regresand ~ regressors + 0)

it will be forced to set the intercept to 0 and return a model that contains only the coefficients c1..cn and looks like

y = c1*x1 + c2*x2 ... + cn*xn

Calling it this way:

lm(regresand ~ regressors)

will also calculate the intercept c and return a model that looks like this:

y = c + c1*x1 + c2*x2 ... + cn*xn

I have the basic idea from here: http://quanttrader.info/public/testForCoint.html and there he uses the first form and forces the intercept to zero and this has confused me because the author of this website surely has done more linear regressions in his life than me so far. But this doesn't mean that this howto is error free.

But I don't see why this should be necessary for forex, we have leverage and trade price *differences* and they are always small compared to the absolute price. We can basically shift the y axis like we want to make the model fit because the absolute value or offset does not matter for our purpose. IMHO.


Quote from the above website:
Inserted Code
The spread is defined this way.

 [i]S[/i] = [i]y[/i] - (β × [i]x[/i])
  
where β is the hedge ratio

this seems to be the only reason why he wants to fit a model without intercept. IMHO in forex a spread (or for my purposes the equivalent thereof) could just as well be defined as

Inserted Code
 [i]S[/i] = [i]y[/i] - (β × [i]x[/i]) - c

and then we would fit a model that also includes a constant term.
 
1
  • Post #17
  • Quote
  • Edited 3:48pm Oct 28, 2010 3:35pm | Edited 3:48pm
  •  Craig
  • Joined Feb 2006 | Status: Blah blah blah | 1,410 Posts
I see, I actually went though that link as well a while ago, his code is wrong, you need the form with a non-zero intercept.
You are correct that the intercept only forms an offset, but you need this offset to calculate the spread, but to trade the spread you are only concerned with the beta (or betas).

Edit: I see you have added some stuff to you post.
Let's say I have to stocks s1 & s2, and I believe there is a linear relationship between the two, which means there is a model s2 = b * s1 + c (b = beta, c = constant).
By running the regression, you estimate b & c, the spread is then formed as spread = s2 - (b * s1 + c), the spread is the model error.
To trade the spread however, we are only concerned with the size and sign of b.
The breaking of a wave cannot explain the whole sea.
 
 
  • Post #18
  • Quote
  • Oct 28, 2010 3:53pm Oct 28, 2010 3:53pm
  •  7bit
  • Joined Mar 2009 | Status: Member | 1,231 Posts
Quoting Craig
Disliked
Let's say I have to stocks s1 & s2, and I believe there is a linear relationship between the two, which means there is a model s2 = b * s1 + c (b = beta, c = constant).
By running the regression, you estimate b & c, the spread is then formed as spread = s2 - (b * s1 + c), the spread is the model error.
To trade the spread however, we are only concerned with the size and sign of b.
Ignored
Exactly.

After removing the + 0 from the call to lm() it seems to fit much better during many time periods and spreads that were previously trending without allowing it the constant term can now be made stationary.
 
 
  • Post #19
  • Quote
  • Oct 28, 2010 3:57pm Oct 28, 2010 3:57pm
  •  Craig
  • Joined Feb 2006 | Status: Blah blah blah | 1,410 Posts
Quoting 7bit
Disliked
After removing the + 0 from the call to lm() it seems to fit much better
Ignored
Yep, you got it.
The breaking of a wave cannot explain the whole sea.
 
 
  • Post #20
  • Quote
  • Oct 28, 2010 4:27pm Oct 28, 2010 4:27pm
  •  7bit
  • Joined Mar 2009 | Status: Member | 1,231 Posts
here is a nice dip to buy: (the factors should now be correct)
Attached Image

and on the H4:
Attached Image
 
 
  • Trading Discussion
  • /
  • Synthetic hedges, cointegration, mean reversion and similar stuff
  • Reply to Thread
    • Page 1 23456 21
    • Page 1 234 21
0 traders viewing now
  • More
Top of Page
  • Facebook
  • Twitter
About FF
  • Mission
  • Products
  • User Guide
  • Media Kit
  • Blog
  • Contact
FF Products
  • Forums
  • Trades
  • Calendar
  • News
  • Market
  • Brokers
  • Trade Explorer
FF Website
  • Homepage
  • Search
  • Members
  • Report a Bug
Follow FF
  • Facebook
  • Twitter

FF Sister Sites:

  • Metals Mine
  • Energy EXCH
  • Crypto Craft

Forex Factory® is a brand of Fair Economy, Inc.

Terms of Service / ©2023