Emotional Control. Process, not outcome. 
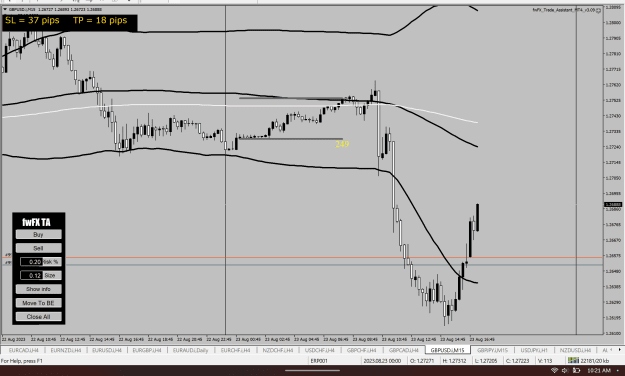
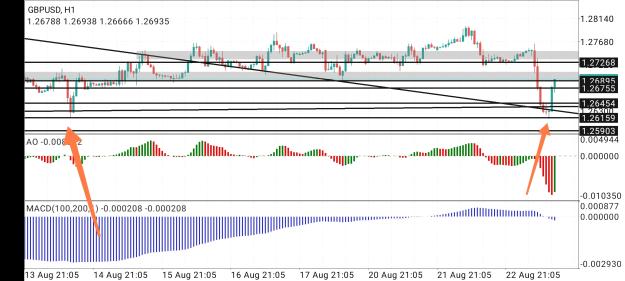
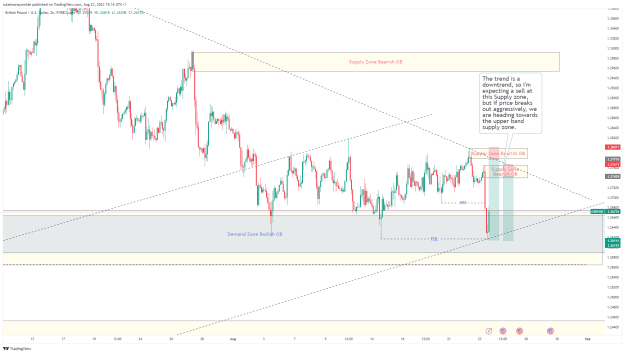
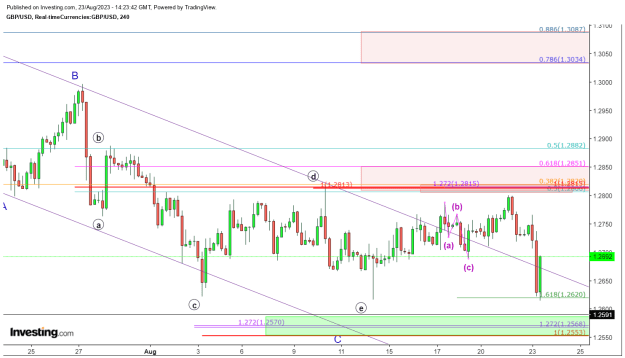
 Cable Update (GBPUSD)
- #769,721
- Aug 23, 2023 8:48am Aug 23, 2023 8:48am
- Joined Dec 2019 | Status: Going with the flow | 2,033 Posts
- #769,722
- Aug 23, 2023 8:49am Aug 23, 2023 8:49am
- Joined Dec 2011 | Status: Postmaster | 11,928 Posts
POSTMASTER
- #769,723
- Aug 23, 2023 8:52am Aug 23, 2023 8:52am
- Joined Dec 2011 | Status: Postmaster | 11,928 Posts
POSTMASTER
- #769,724
- Aug 23, 2023 8:53am Aug 23, 2023 8:53am
- Joined Oct 2020 | Status: couldn't give a flying duck | 7,381 Posts
- #769,725
- Aug 23, 2023 8:55am Aug 23, 2023 8:55am
- Joined Oct 2020 | Status: couldn't give a flying duck | 7,381 Posts
- #769,726
- Aug 23, 2023 8:57am Aug 23, 2023 8:57am
- Joined Dec 2019 | Status: Going with the flow | 2,033 Posts
Emotional Control. Process, not outcome.
- #769,727
- Aug 23, 2023 8:59am Aug 23, 2023 8:59am
- Joined Oct 2020 | Status: couldn't give a flying duck | 7,381 Posts
- #769,728
- Aug 23, 2023 8:59am Aug 23, 2023 8:59am
- Joined Oct 2020 | Status: Trader | 14,081 Posts
Insane in the Brain..
- #769,729
- Aug 23, 2023 9:01am Aug 23, 2023 9:01am
- Joined Dec 2019 | Status: Going with the flow | 2,033 Posts
Emotional Control. Process, not outcome.
- #769,731
- Aug 23, 2023 9:02am Aug 23, 2023 9:02am
- Joined May 2021 | Status: Trader | 7,225 Posts
People don't plan to lose. They lose because they don't plan.
- #769,732
- Aug 23, 2023 9:02am Aug 23, 2023 9:02am
- Joined Oct 2020 | Status: couldn't give a flying duck | 7,381 Posts
- #769,733
- Aug 23, 2023 9:05am Aug 23, 2023 9:05am
- Joined Dec 2019 | Status: Going with the flow | 2,033 Posts
Emotional Control. Process, not outcome.
- #769,734
- Aug 23, 2023 9:21am Aug 23, 2023 9:21am
- Joined Dec 2017 | Status: Trader | 30,688 Posts
yes yes yes
SKQT - Super Kool Quant Trader
Daily Remy All Time Return:
5.6%
- #769,736
- Aug 23, 2023 9:23am Aug 23, 2023 9:23am
- Joined Oct 2020 | Status: Trader | 14,081 Posts
Insane in the Brain..
- #769,737
- Aug 23, 2023 9:25am Aug 23, 2023 9:25am
- Joined Dec 2017 | Status: Trader | 30,688 Posts
yes yes yes
- #769,740
- Aug 23, 2023 9:29am Aug 23, 2023 9:29am
- Joined Oct 2009 | Status: Trader | 5,673 Posts
Always trade your own plan...I don't provide trading signals.