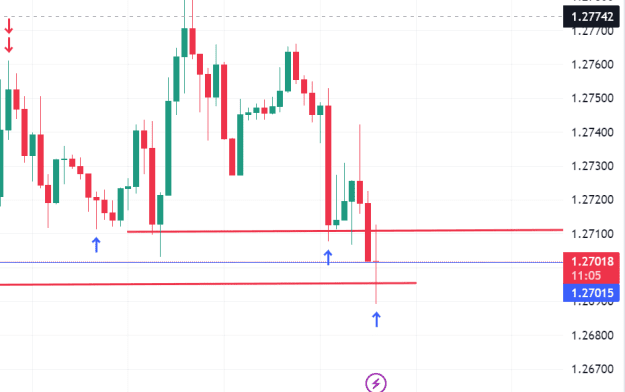
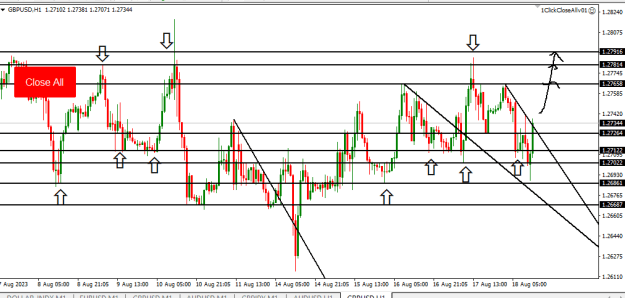
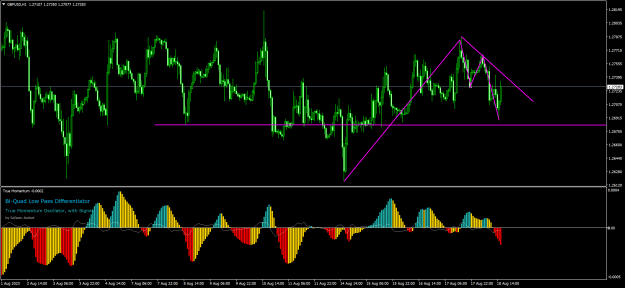
DislikedI1. Current Position and Moving Averages: As of the latest market data, GBP/USD stands at 1.275. A crucial aspect of technical analysis involves examining moving averages, which provide insights into the historical price trends of an asset. On the daily time frame, GBP/USD has dipped below its 21-day moving average, indicating a potential shift towards a bearish trend. Additionally, on the 1-hour time frame, the pair has slipped below the 200-hour moving average, further strengthening the bearish outlook. 2. Bearish Projection: Based on the technical...Ignored
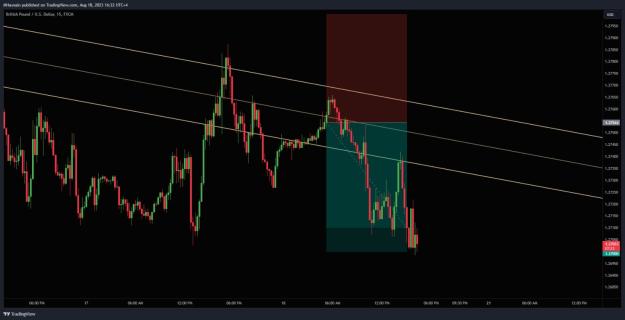
Utilizing the preceding trading analysis, I executed a short position on this currency pair initiated at 1.275, successfully capitalizing on a profit-taking at the 1.27 mark today. Given the absence of market data during the current New York session, I have concluded my trading activities for the day.
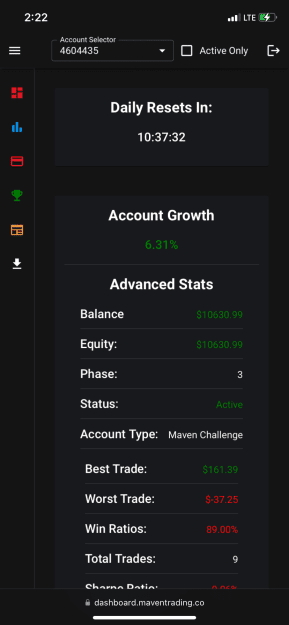
Moving forward, I will be closely monitoring the market for potential bearish prospects over the course of the upcoming week. For your reference, I have enclosed a Trading View chart within this communication. Additionally, I encourage you to see my comprehensive trading journal, available within my profile.
Attached Image (click to enlarge)
1