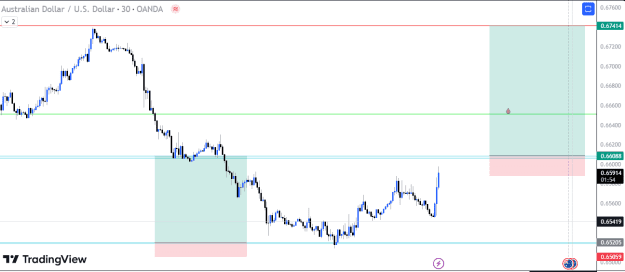
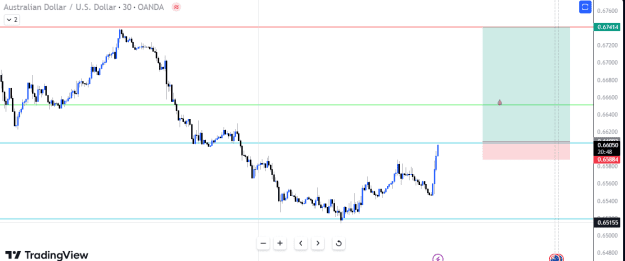
{quote} The target will be around the MA200-H1. A lot of sell orders waiting the bulls there. {image}
Ignored
A lot of sell orders waiting the bulls there.
That was presented like a fact. What data source are you using that led you to that conclusion? Or is it simply speculation?
{quote} So is it the combination of the low activity at the tails of the distribution along with the directional pin bars that is doing the signaling? Because I see to the left in the area of the POC that there is also a set of direction pin bars and price continued down.
Ignored
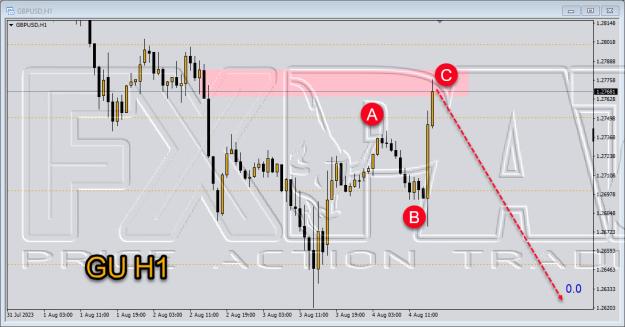
It's a confluence of information. Yesterday a peak formation low was put in. Leading up to yesterday, the EMA's were tested and respected, indicating trend, and 'momentum' to the downside. Thursday, the Asia dealer broke out to the downside, EU worked it, and the US dealer snatched price away from lower level sellers. After years of studying charts, price action, meeting a retired broker, I learned to never follow the trend, especially down towards a peak formation, OR at the end of a trade week. The reason being that the dealer can only trend for so long, and their equity does run out when creating the trend and filling orders. Never trade back to a peak formation. Jammed trend-followers in those extremes are high, and the dealer isn't about to give them their money back. Just before the US open, there is a NFP release. If the dealer was finished working the downside, then a shift in price upward behind the news would be a perfect excuse!
The news came out, the dealer shot up, lower level sellers in margin call are cleared off the board, the market maker pockets the money, and a new movement is put in.
Hope this helps!
Discouragement is the language of the devil. Results over hype.
{quote} A lot of sell orders waiting the bulls there. That was presented like a fact. What data source are you using that led you to that conclusion? Or is it simply speculation?
{quote} I think it was also a pop further down to entice folks that either were short or considering to go short that they called it right, so they jumped in short and. . .
Ignored
I think this could be one of the "tricks" programmed into an algo: When needing price to go up, check for liquidity near the current price and if sufficiently large, send a spike down, then resume the move up as rapidly as conditions allow.
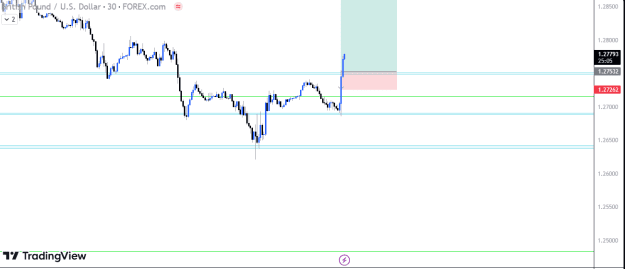
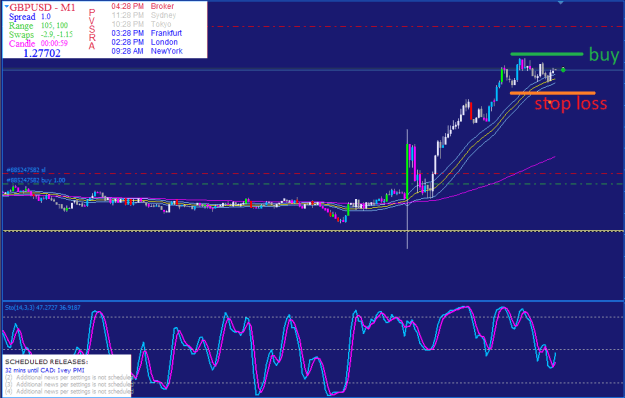
I'm surprise to see this movement to the up side.... i expected GU to seek more liquidity to the downside at least around 1.2500... but it bought back.. I guess there is no much money sitting below those areas.. Now its a free ride to the upside... Take position ASAP
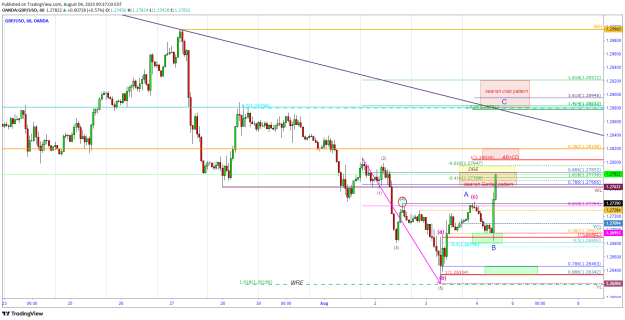
{quote} Mr Coreg mind i get your EW opinion, Wave still in play? {image} Was expecting 30 mins timeframe wave (ii) to be a spike higher in case NFP is bad but close below starts of Wave (i)
Ignored
Fardeen, I will come back later with my point of view. Sorry.
Attached Image (click to enlarge)
Always trade your own plan...I don't provide trading signals.
I'm surprise to see this movement to the up side.... i expected GU to seek more liquidity to the downside at least around 1.2500... but it bought back.. I guess there is no much money sitting below those areas.. Now its a free ride to the upside... Take position ASAP {image}
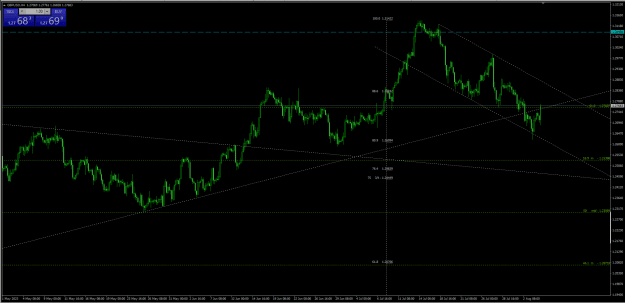
Considering the origin of the Whole move down D1 , the structure unfolds down to H4 subdivision , H4 subdivides on H1 , so for me it was clear to see H4 was moving against D1 therefore implying a corrective move against D1 origin of swing, does not mean i traded long as my bias is short from the D1 down swing.
Follow The Markets Structure - Patience and Discipline
{quote} Consider modeling financial time series according to chaos theory. That is, price is a point moving through trading space, stretching or folding the space as it moves. Because we are dealing with self-similarity and fractal patterns, just as we can see a pattern in a plot of the Mandlebrodt set that by zooming in, EXACTLY the same pattern is repeated, we see the same with financial time series. And the zooming in (or out) can be done to ANY degree, and that pattern is ALWAYS there. This is why we can make a currency plot of say closing price...