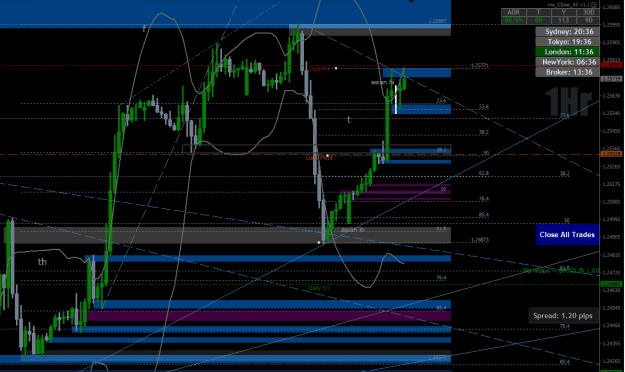
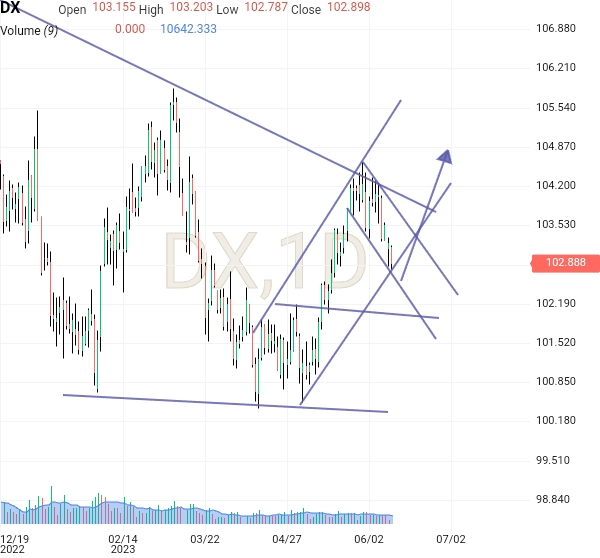
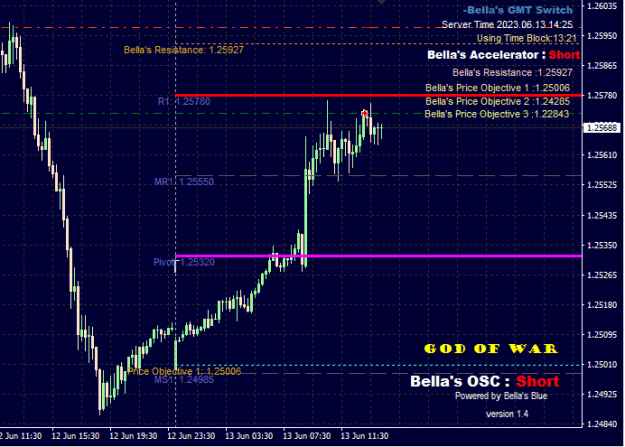
G/M, all 10/20/40ema's are crossed up from 5min - wkly t/f, per graphic below. That long-term desc t/line that joins 4249 - 3249 - 2679 is just above last week's 2600 hi and the one that joins said 2679 with last week's 2600 hi is below that, and shown on chart below. This pairing benefited this Uk morning from good uk employment data, after y/day's fall.
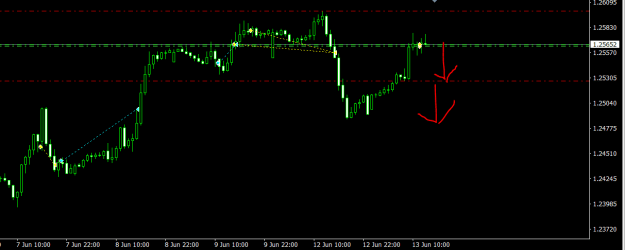
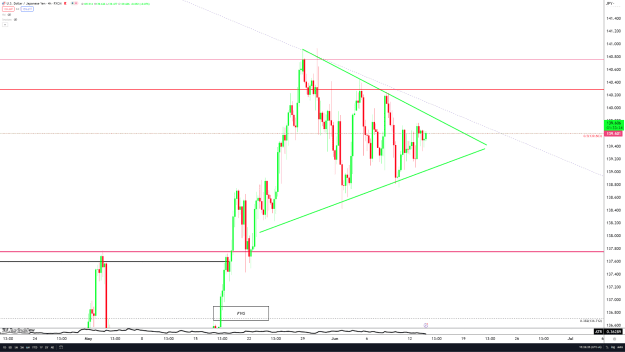
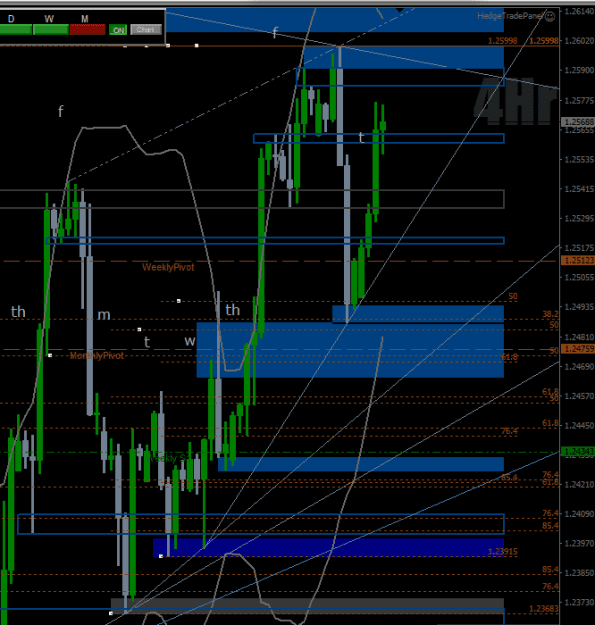
4hr below
4hr below
Attached Image(s) (click to enlarge)

Trader with an Edge.
5