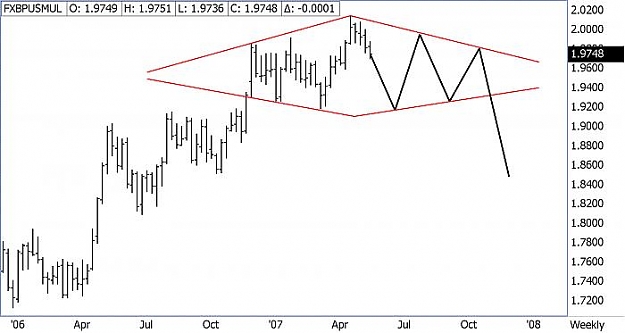
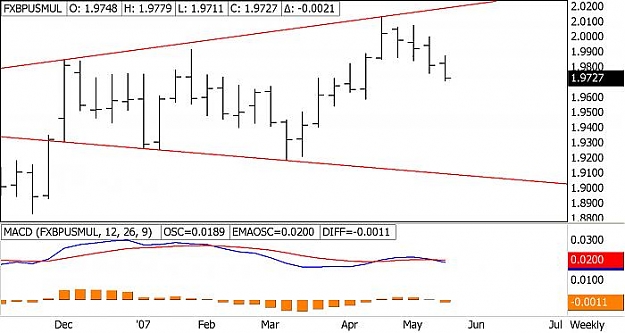
DislikedI'm surprised to read this. Many of your templates are based on range breakout. Doesn't the existence of a range imply that until some moment horizontal lines served as S/R?Ignored
 Igrok Method. Q's & A's. Comments, thoughts and ideas


- #331
- May 18, 2007 10:58am May 18, 2007 10:58am
- | Joined Nov 2006 | Status: Seeking Light | 1,059 Posts