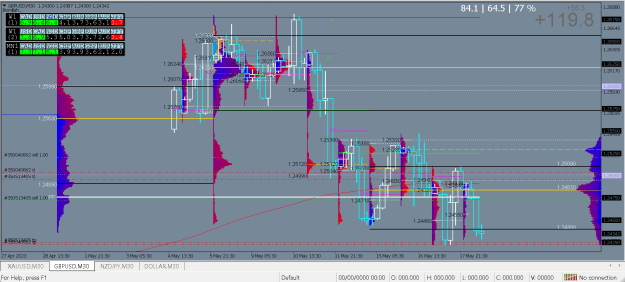
starting buying this place one more time, risk is we can go to 2380 or more but I dont wonna miss a thing, so first buy 2435 pendings every 10 pip till 2375, this is GU, EU already activeted 0833, 0825, 0815, pendings 0805, 0795, 0785, patience
People don't plan to lose. They lose because they don't plan.
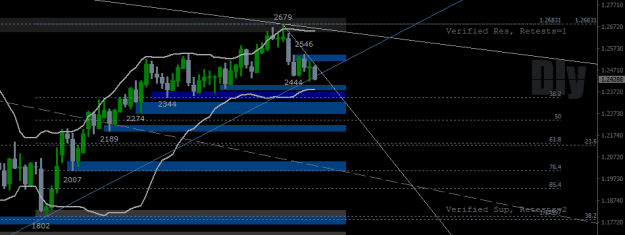
...price probably just about touched top of that prev 1hr/4hr sw lo zone that extends down to y/day's 2421 lo = prev supp = pot supp. 1st upside hurdle for the bulls - that prev 1hr minor sw lo zone = prev supp = pot sbr...not historically a strong pattern this one...but you never know!
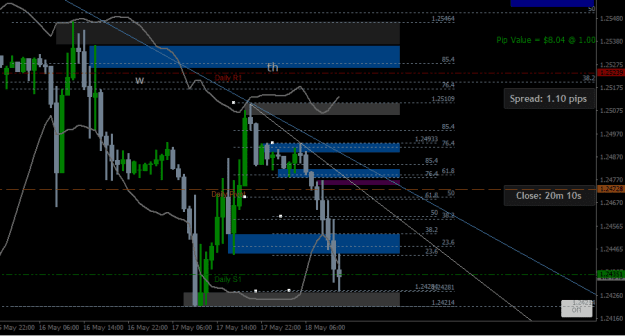
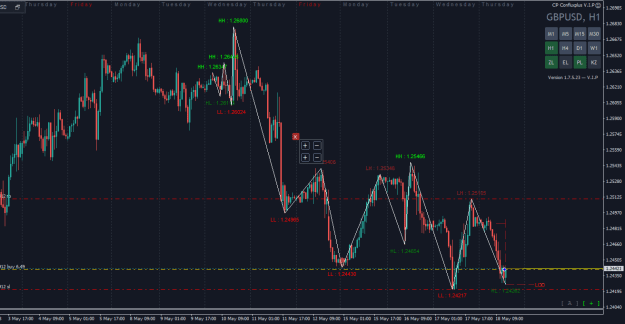
Sold 1.2505... target 1.2360... stop 1.2565... I'm leaving to hit either TP or SL...
Ignored
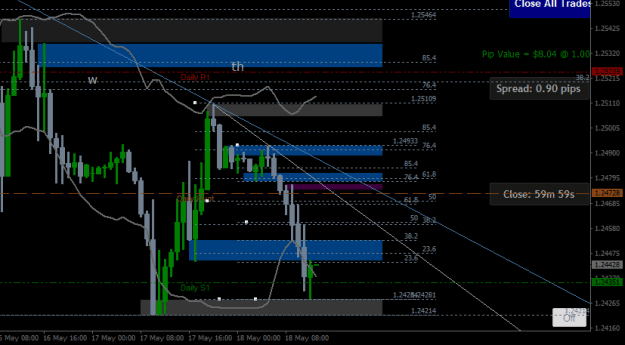
Exited at 1.2435... +70 pips...
Reason for closure is last months range was 310 pips, and this month so far is 260 pips, which happens to be same price range as at 18th of April.
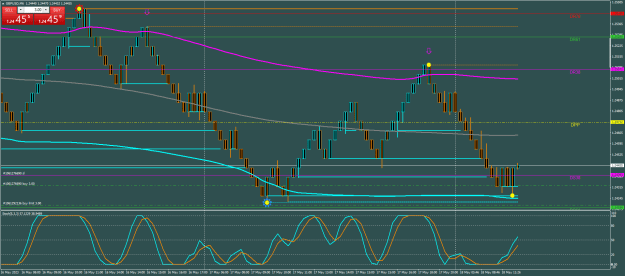
IMO the US Unemployment Claims is going to come higher then expected and there fore GU long will trigger from there on , this is my gut feeling, that is why i am still short + GU is having hard time going below S1
...below the prev 1hr/4hr sw lo zone that extends to y/day's 2421 lo those prev 1hr/4hr/minor dly sw lo zones that extend 1st to 2364 then 2334, both once tested and held as supp - on the dly t/f. Potential supp probably from circa 2395 to 2344 then.