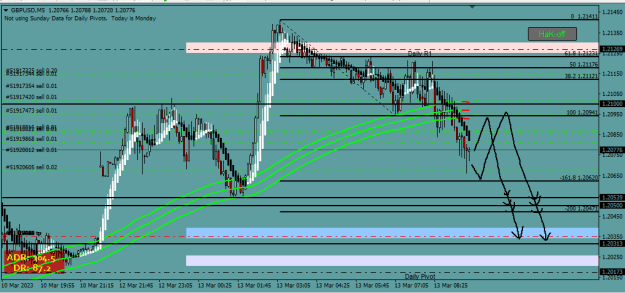
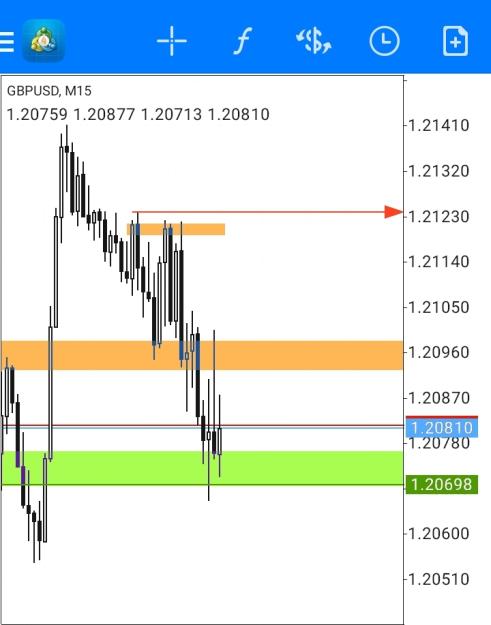
Disliked{quote} I'm using ICT's techniques, but I get the same disastrous results if I use indicators. Take for example the screenshot from the 5 minute chart. Yellow lines ate the highs of candles on higher timeframes, for support. Red lines are either liquidity above or below. Red boxes are OBs, Yellow boxes are FVGs. So which am I meant to be targeting? I can even see this in ICTs videos, he'll be talking about this amazing entry in an FVG, but I'm pointing at the screen at one that occurred just minutes before that didn't work he totally ignores. If...Ignored
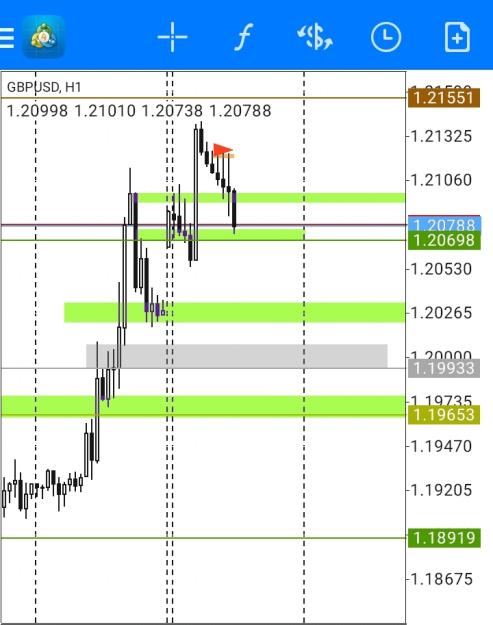
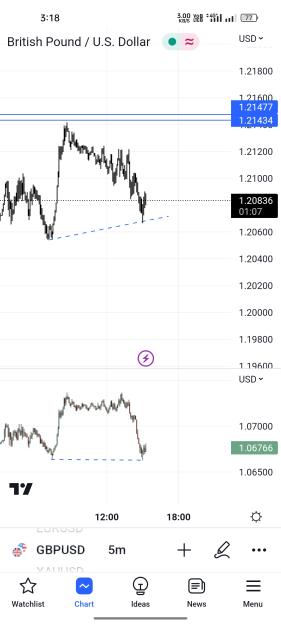
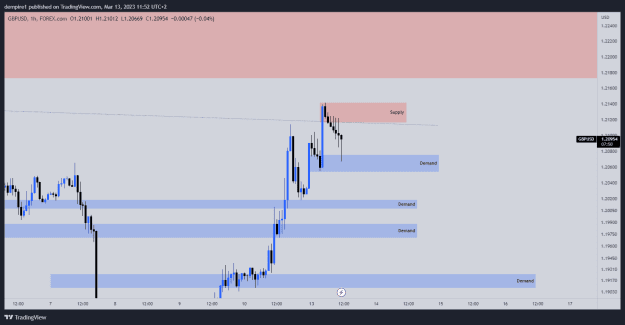
What you are missing is the context. Just check the 1h chart and see that theres still an 1h FVG to be filled before reaching for any higher liquidty.
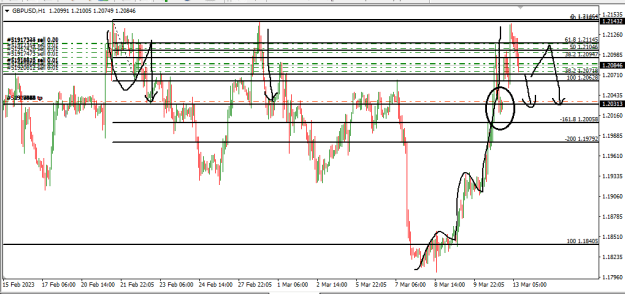
Next see that under that is a huge gap, which is likely to be filled. London often takes buyside before going to the correct direction. Just because it is a break to the upside does not mean, that it will continue. Check the swing that broke to the upside. It broke to the downside after that.
All the people from last week are still long and holding for higher targets. Would make more sense to take sellside first.
ICT's techniques work wonders, if you know the context.
1