GBPUSD Weekly Technical Outlook
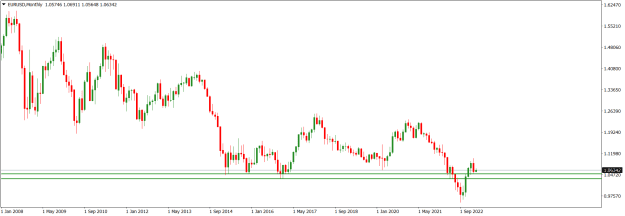
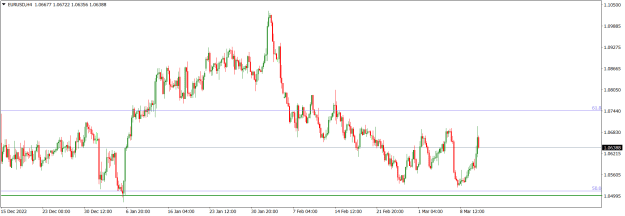
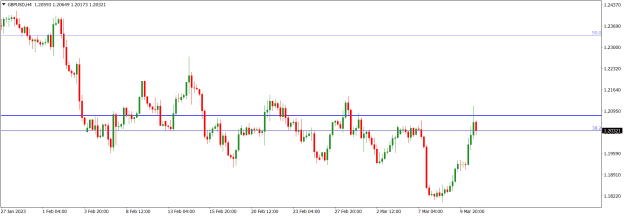
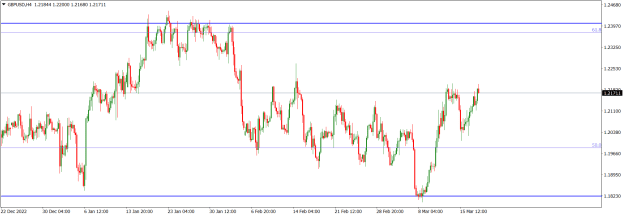
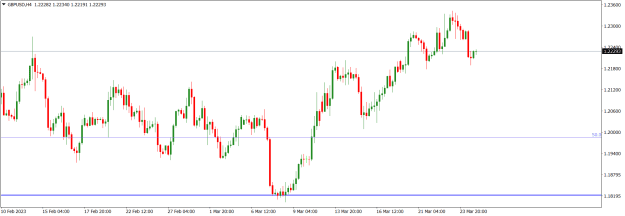
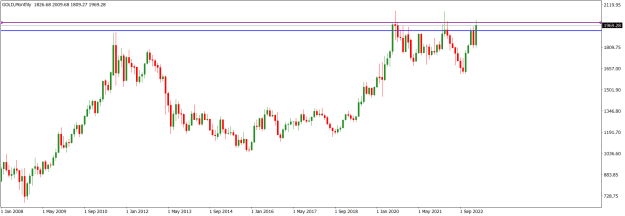
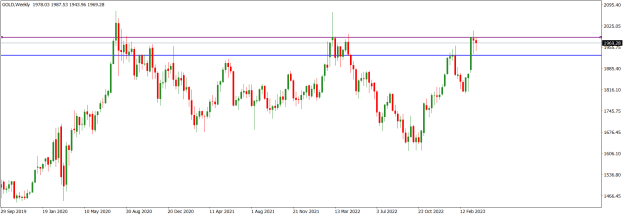
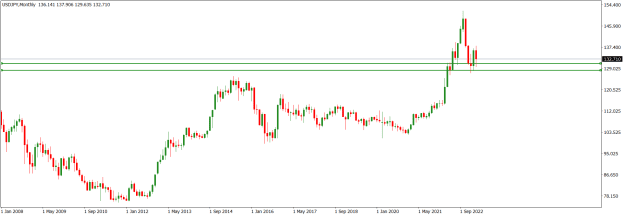
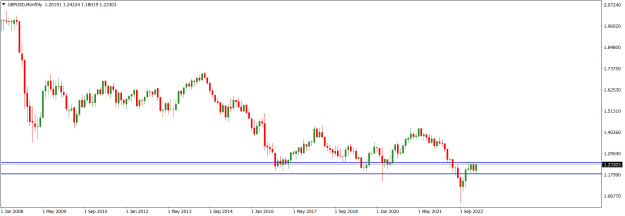
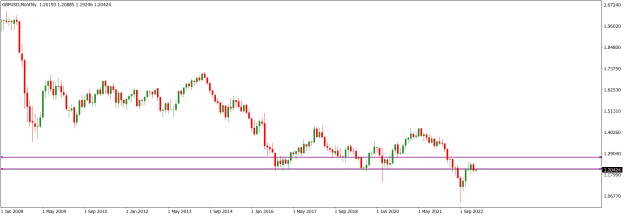
GBPUSD market operation is within the 1.20810/1.27000 horizontal resistance zone (purple). On the monthly time frame, market operation made a bullish re-test of the zone in November 2022 and has been tackling the zone since. Although the February candlestick print was bearish, the technical mode on the monthly time frame is sideway.
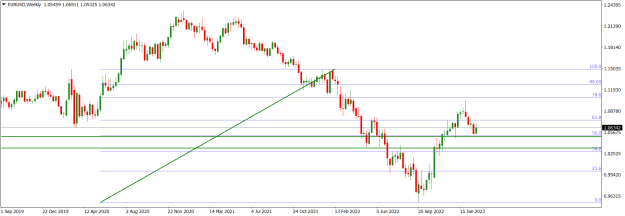
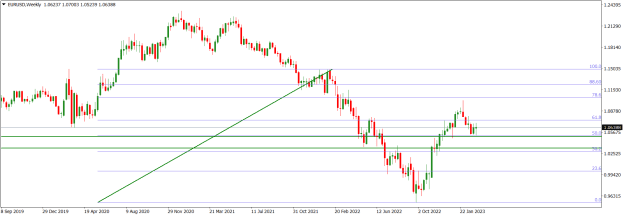
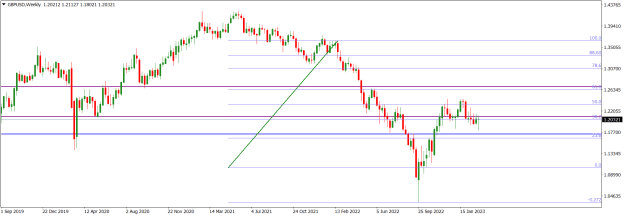
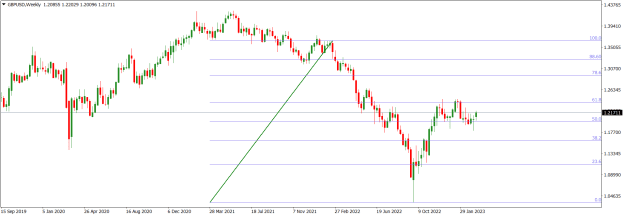
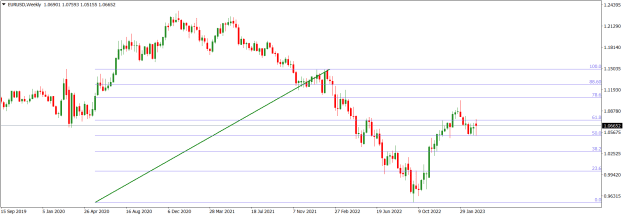
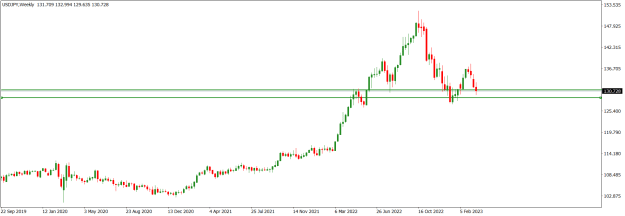
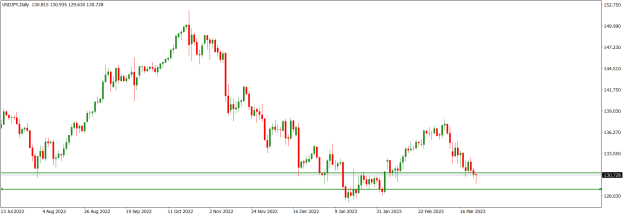
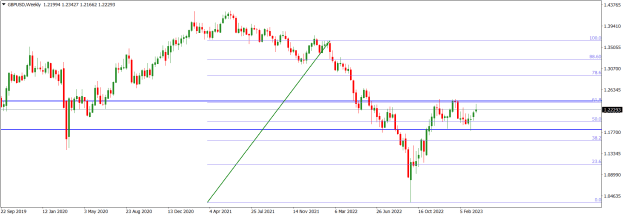
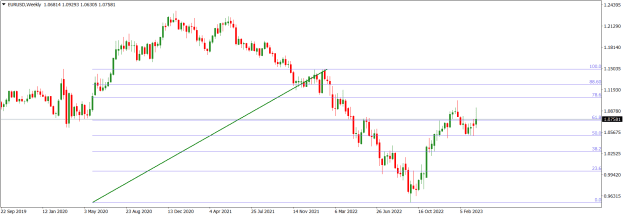
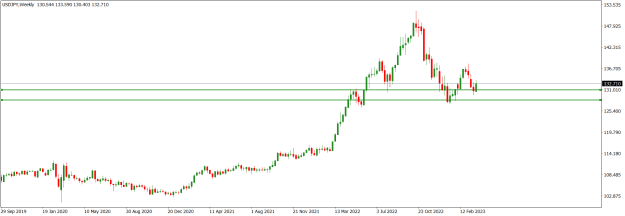
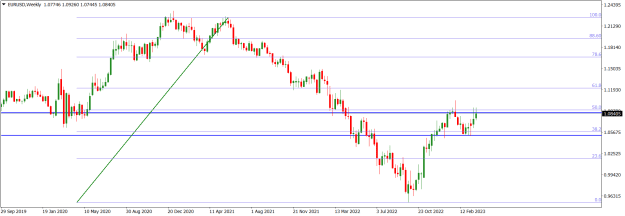
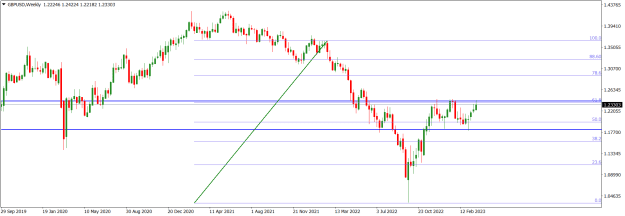
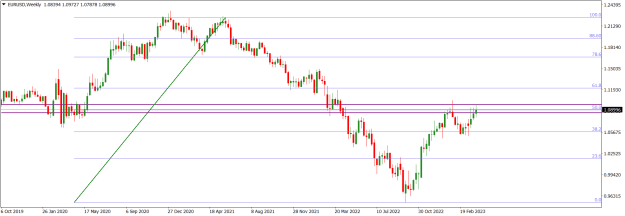
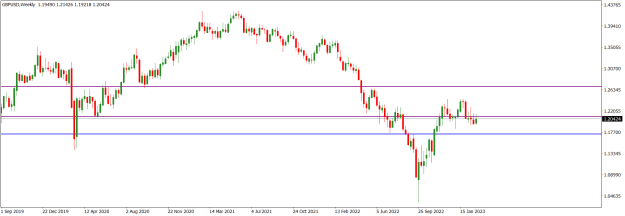
GBPUSD market operation on the weekly time turned sideways after a bearish displacement from the 1.20810/1.27000 horizontal resistance zone (purple) seen on the monthly time frame. This indicates a decline in bearish momentum. Nevertheless, we may still see a southward push towards the 1.17300 extension area (blue).
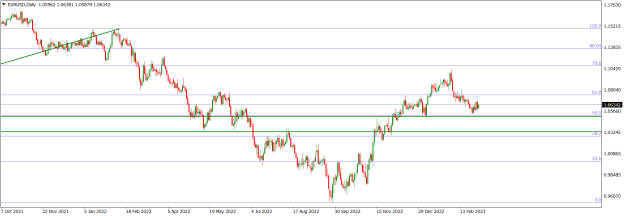
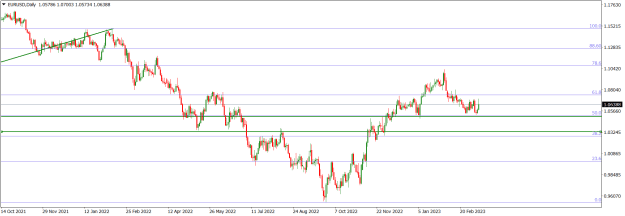
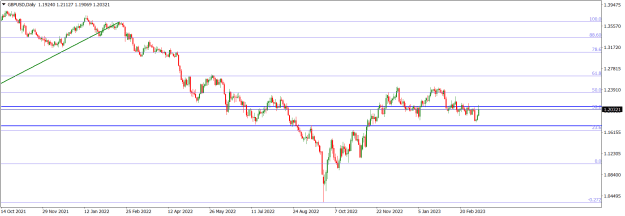
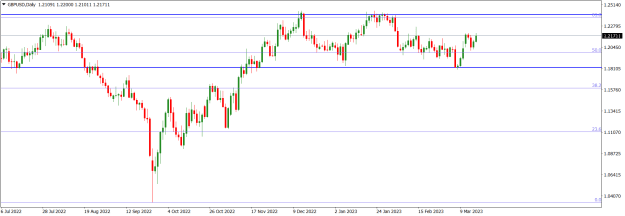
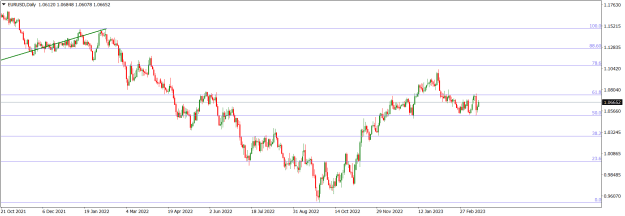
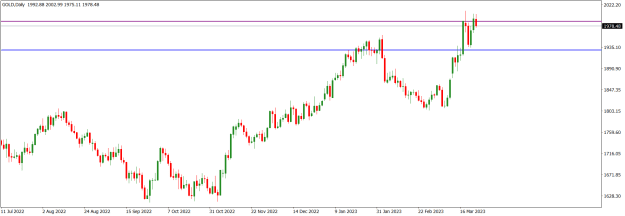
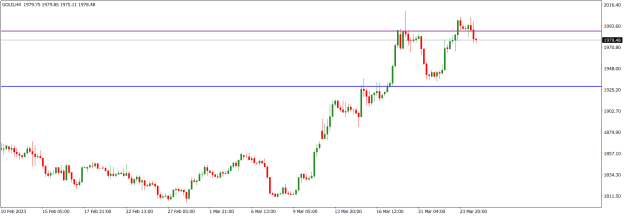
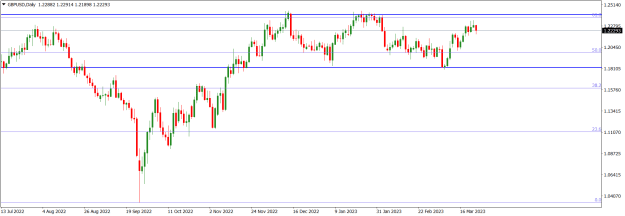
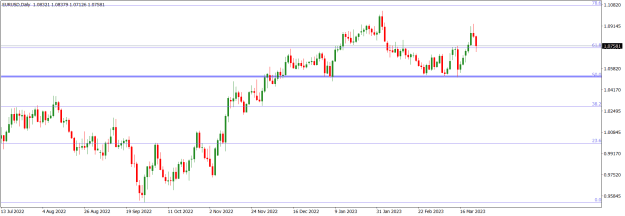
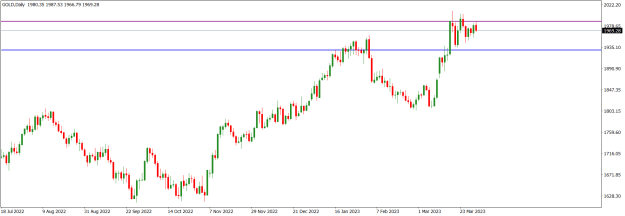
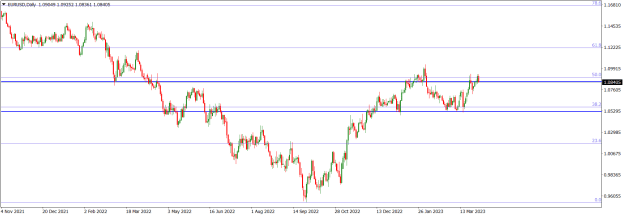
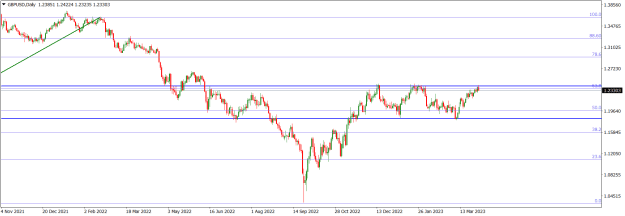
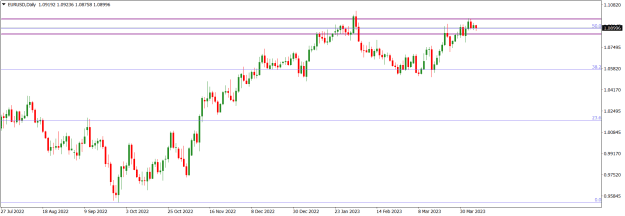
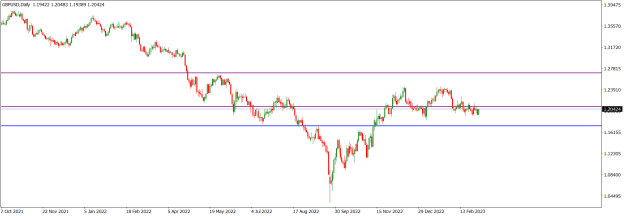
GBPUSD price action on the daily time frame had been grinding a bullish correction for several days as it tackles the 1.20810/1.27000 horizontal resistance zone (purple) seen on the monthly time frame. It turned sideways after a bearish push to the lower boundary of the zone. The technical structure is predominantly bearish, but we cannot rule out a northward liquidity engineering before further southward drive. Nevertheless, should there be a bearish surge of price action in the early part of this week, we may see the 1.17300 horizontal support area (blue) exposed.
I may be wrong. Trade safe and prosper.
KP
GBPUSD market operation is within the 1.20810/1.27000 horizontal resistance zone (purple). On the monthly time frame, market operation made a bullish re-test of the zone in November 2022 and has been tackling the zone since. Although the February candlestick print was bearish, the technical mode on the monthly time frame is sideway.
Attached Image (click to enlarge)
GBPUSD market operation on the weekly time turned sideways after a bearish displacement from the 1.20810/1.27000 horizontal resistance zone (purple) seen on the monthly time frame. This indicates a decline in bearish momentum. Nevertheless, we may still see a southward push towards the 1.17300 extension area (blue).
Attached Image (click to enlarge)
GBPUSD price action on the daily time frame had been grinding a bullish correction for several days as it tackles the 1.20810/1.27000 horizontal resistance zone (purple) seen on the monthly time frame. It turned sideways after a bearish push to the lower boundary of the zone. The technical structure is predominantly bearish, but we cannot rule out a northward liquidity engineering before further southward drive. Nevertheless, should there be a bearish surge of price action in the early part of this week, we may see the 1.17300 horizontal support area (blue) exposed.
Attached Image (click to enlarge)
I may be wrong. Trade safe and prosper.
KP
Do your homework, follow the footprints of smart money