GBPUSD Weekly Technical Outlook
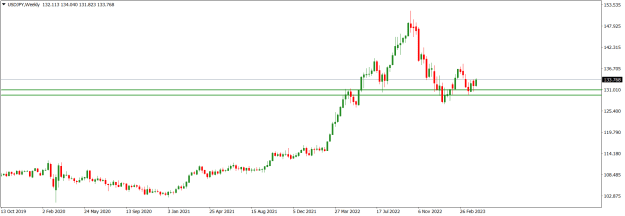
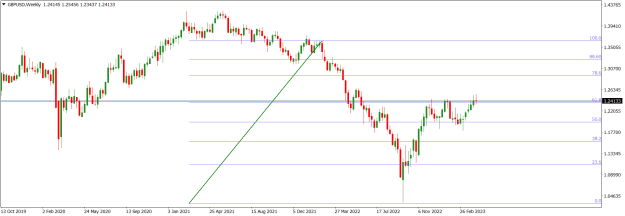
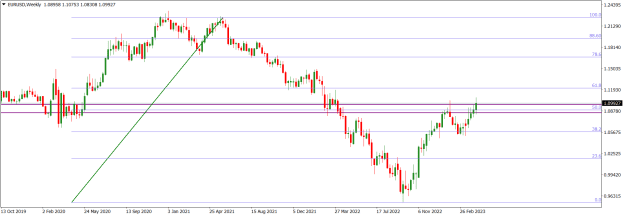
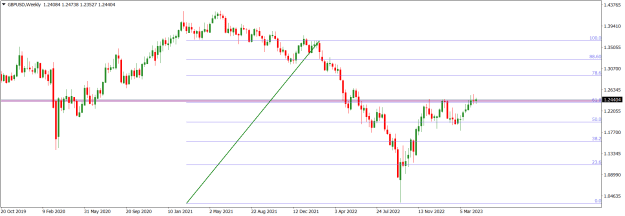
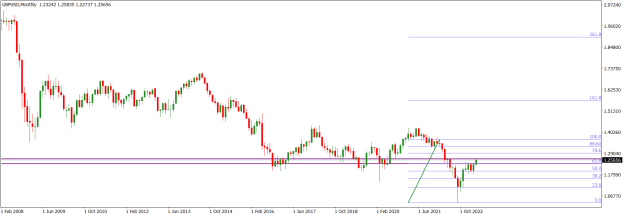
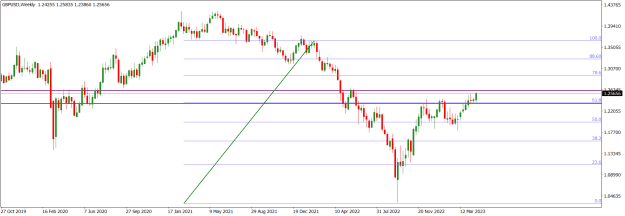
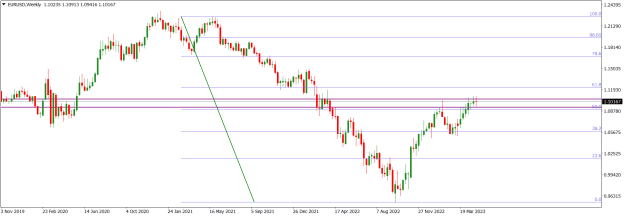
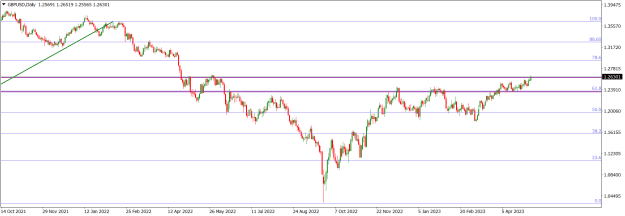
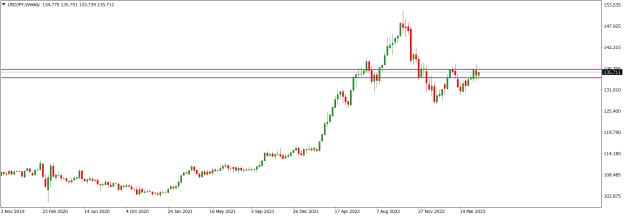
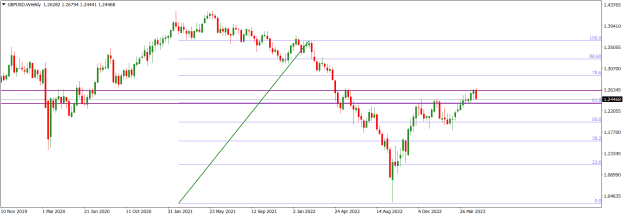
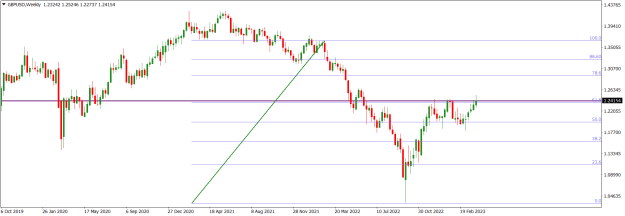
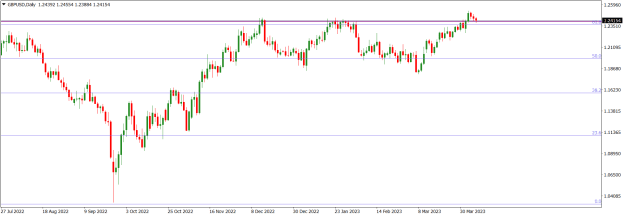
Since the last week in November 2022, GBPUSD market operation has made three strong bullish charges at the 1.24060 horizontal resistance area (purple) without breaking it. The area aligns with the 61.8 Fib retracement area of the 1.36380/1.03340 bearish swing. Last week’s bullish charge at the area met a bearish pushback.
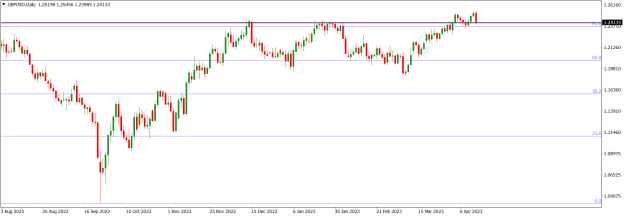
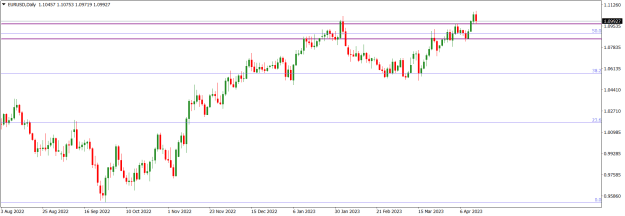
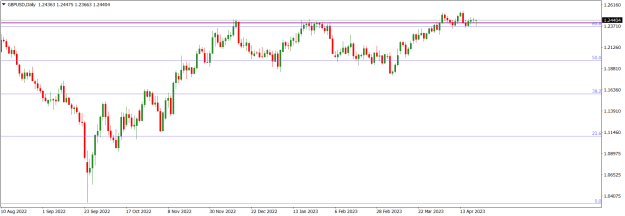
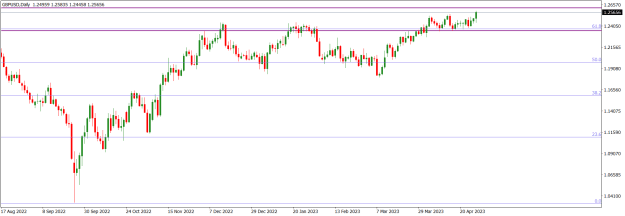
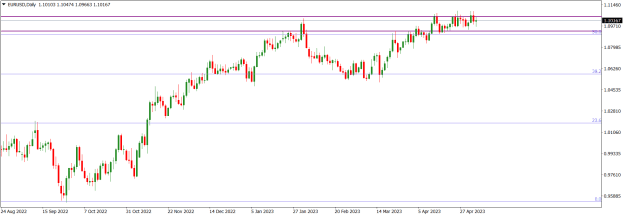
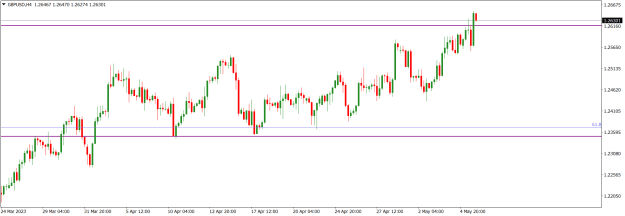
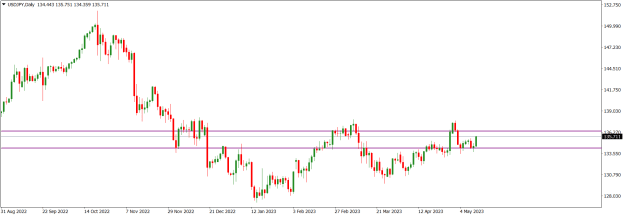
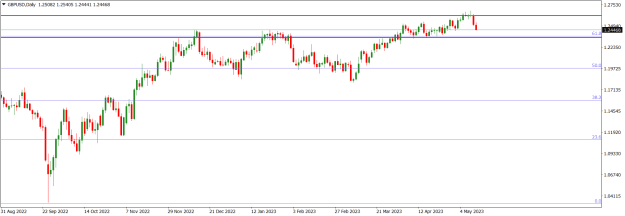
On Tuesday, GBPUSD price action on the daily time frame broke above the 1.24060 horizontal resistance area (purple), the first time since 16 June 2022, before a bearish pushback that started on Wednesday. The bullish charge of Tuesday may incentivize further bullish attempt this week, but as the area is a technically strong horizontal resistance and aligns with the 61.8 Fib retracement area of the 1.36380/1.03340 bearish swing, we may not see much bullish drive.
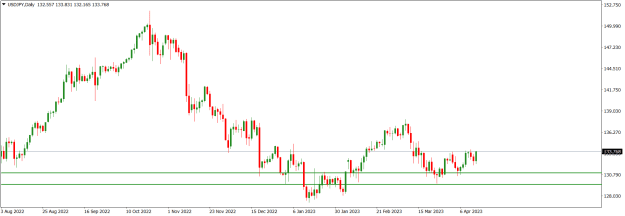
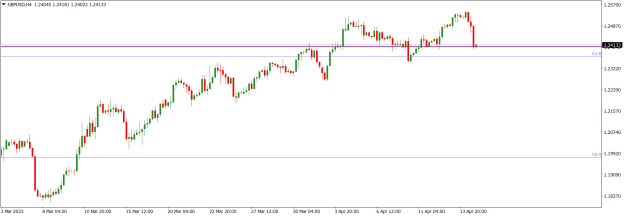
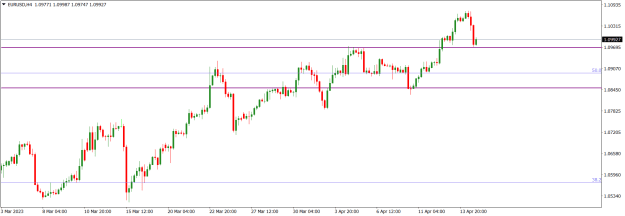
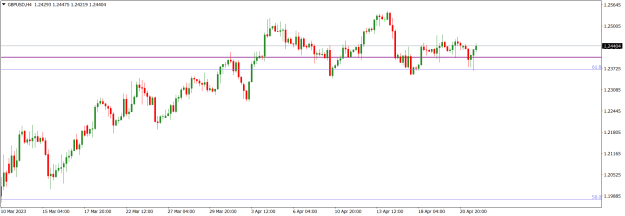
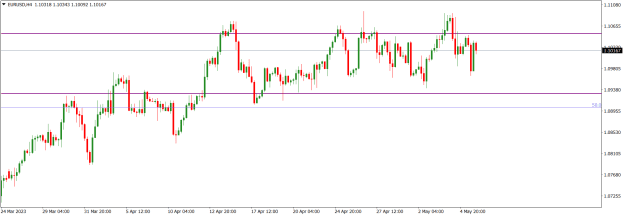
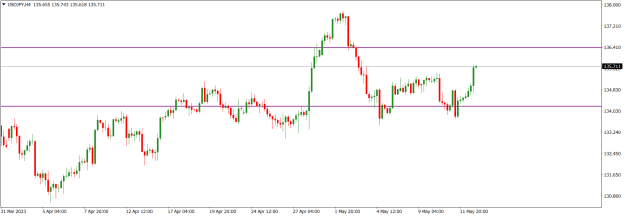
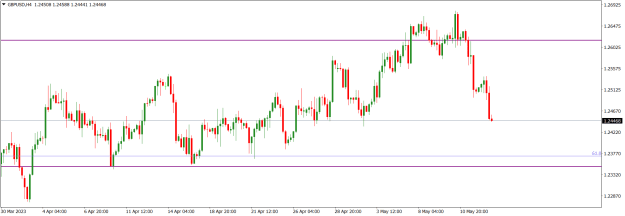
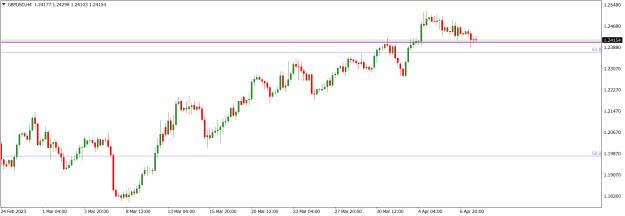
On Tuesday, GBPUSD price action on the H4 time frame made a brief bullish breakout from the 1.24060 horizontal resistance area (purple), seen on the weekly time frame, but turned bearish on Wednesday. Presently, price action is sideways around the area, but we cannot rule out further northward liquidity engineering before a southward rotation. The dominant technical structure is bearish.
I may be wrong. Trade safe and prosper.
KP
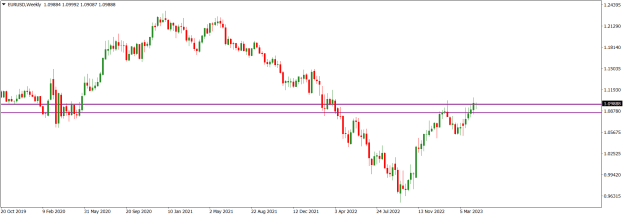
Since the last week in November 2022, GBPUSD market operation has made three strong bullish charges at the 1.24060 horizontal resistance area (purple) without breaking it. The area aligns with the 61.8 Fib retracement area of the 1.36380/1.03340 bearish swing. Last week’s bullish charge at the area met a bearish pushback.
Attached Image (click to enlarge)
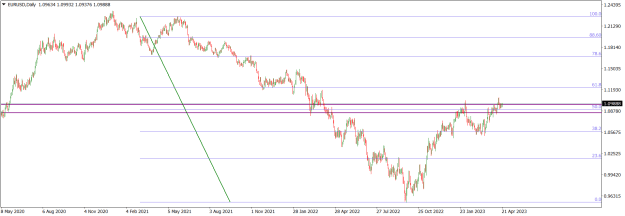
On Tuesday, GBPUSD price action on the daily time frame broke above the 1.24060 horizontal resistance area (purple), the first time since 16 June 2022, before a bearish pushback that started on Wednesday. The bullish charge of Tuesday may incentivize further bullish attempt this week, but as the area is a technically strong horizontal resistance and aligns with the 61.8 Fib retracement area of the 1.36380/1.03340 bearish swing, we may not see much bullish drive.
Attached Image (click to enlarge)
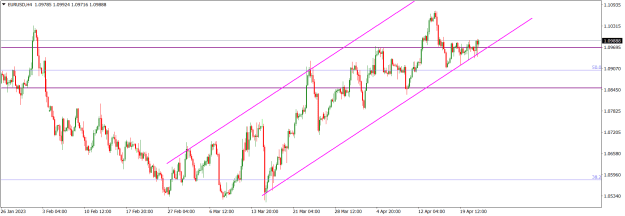
On Tuesday, GBPUSD price action on the H4 time frame made a brief bullish breakout from the 1.24060 horizontal resistance area (purple), seen on the weekly time frame, but turned bearish on Wednesday. Presently, price action is sideways around the area, but we cannot rule out further northward liquidity engineering before a southward rotation. The dominant technical structure is bearish.
Attached Image (click to enlarge)
I may be wrong. Trade safe and prosper.
KP
Do your homework, follow the footprints of smart money
1