{quote} I think that most of us are trying to get a "view" of how price vs time has unfolded on some particular TF(s). When making scatter plots, it is common to apply some visual aid, such as a regression plot, to gain a better "view" of what likely represents the main features of that data. As I have posted before, I similarly make a "smoothed view" via indicators without even having price bars displayed. Only after this smoothed view indicates something of interest do I display the price bars. So for me, the price bars are actually a noisy distraction...
Ignored
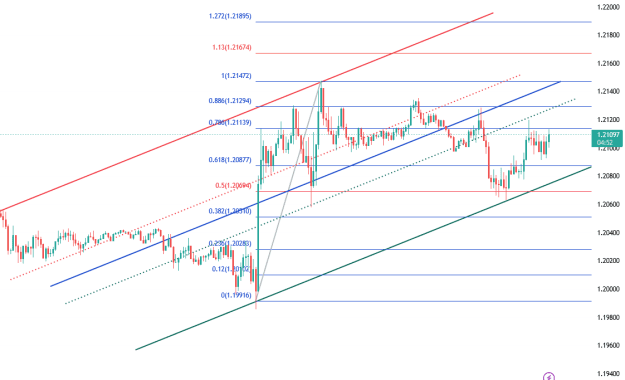
Same m15 chart, but purely using a channel and Fib Levels on the angle to show what's happening. So different strokes for different folks I guess.
{quote} Hello sir, I really am sorry for the delayed response. On my spreadsheet for Feb 15, I had the maximum cumulative volume at a point that corresponds to 1.2096 See the screenshot below {image}
Ignored
Yesterday, I expected sellers to be at the 1.2096 level but the supply failed to hold.
Now, being tested from the upside, the level ought to act as a demand level.
Joined Aug 2018
|
Status: Research Analyst
|4,295 Posts
Hello guys, the price seem to be confined to a tight range less than 100 pips so far. Fomc is set to provide some fireworks but the range is still expected to be limited to 100 - 120 pips as 88% of this month's expected range is already complete.
Price is expected to stay within the confines of 1.2220 to 1.1885 for the rest of this February...
Sellable price for the rest of February is 1.2175 - 1.2220
Buyable price for the rest of February is 1.1920 - 1.1885...
Average target of 1.2030 - 1.2050... so expect a lot of price hovering within these levels in the remaining days of February...
Trade safely and remember we gain nothing by hating on others.
Hello guys, the price seem to be confined to a tight range less than 100 pips so far. Fomc is set to provide some fireworks but the range is still expected to be limited to 100 - 120 pips as 88% of this month's expected range is already complete. Price is expected to stay within the confines of 1.2220 to 1.1885 for the rest of this February... Sellable price for the rest of February is 1.2175 - 1.2220 Buyable price for the rest of February is 1.1920 - 1.1885... Average target of 1.2030 - 1.2050... so expect a lot of price hovering within these levels...
Ignored
Thanks for your post Georginson, the question I'm asking myself is this, what exactly happened in that range? Was it accumulation or distribution. Then there's just the small matter of month-end flows that gets brought into the picture.
{quote} I think that most of us are trying to get a "view" of how price vs time has unfolded on some particular TF(s). When making scatter plots, it is common to apply some visual aid, such as a regression plot, to gain a better "view" of what likely represents the main features of that data. As I have posted before, I similarly make a "smoothed view" via indicators without even having price bars displayed. Only after this smoothed view indicates something of interest do I display the price bars. So for me, the price bars are actually a noisy distraction...
{quote} Yesterday, I expected sellers to be at the 1.2096 level but the supply failed to hold. Now, being tested from the upside, the level ought to act as a demand level. Buyers could be there waiting.
Ignored
GU
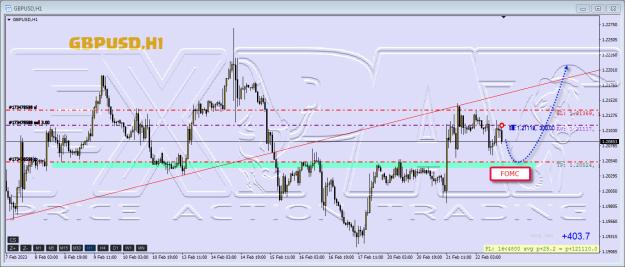
Hello Pip Centurion,
I highly value and anticipate your insights, and I appreciate you sharing them here. In light of the upcoming FOMC meeting, I wanted to share my current trade projection. This is just my perspective, and I welcome the opportunity to exchange ideas with you.
{quote} Thanks for your post Georginson, the question I'm asking myself is this, what exactly happened in that range? Was it accumulation or distribution. Then there's just the small matter of month-end flows that gets brought into the picture. Cheers Guy
Ignored
I may not fully understand your question but let me lazily reply by saying it is more of accumulation of various macro Fundamentals which have already happened and also characteristics of February Months from the perspective of its range behavior.
Checking the fundamentals calendar for the rest of this February looks quite insignificant, hence the range will be limited.
February usually produces between 450 - 600 pips (except if something extraordinary happens do we have more) and so far we already have 485 pips this February...