A real gem from John Ehlers
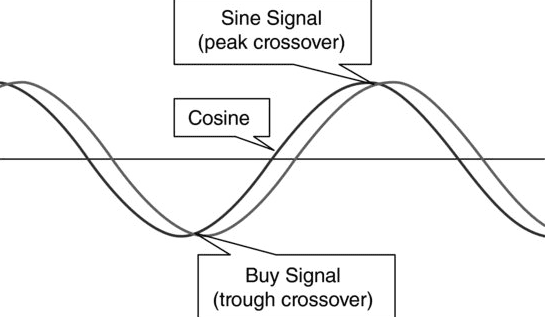
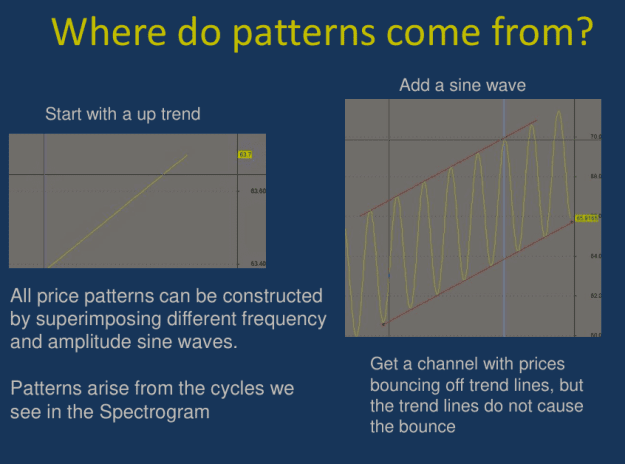
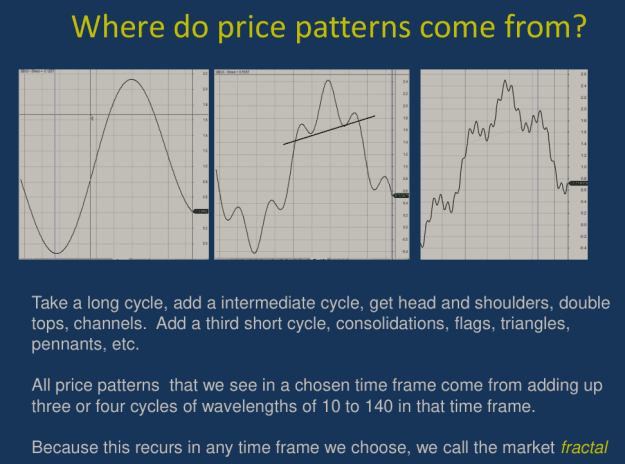
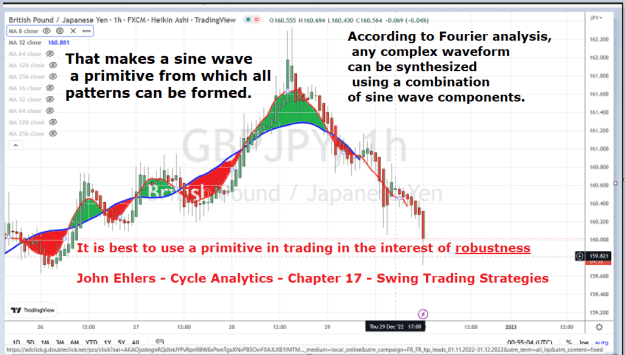
According to Fourier analysis, any complex waveform can be synthesized using a combination of sine wave components.
That makes a sine wave a primitive from which all patterns can be formed.
It is best to use a primitive in trading in the interest of robustness
Cycle Analytics Chapter 17 Swing Trading Strategies
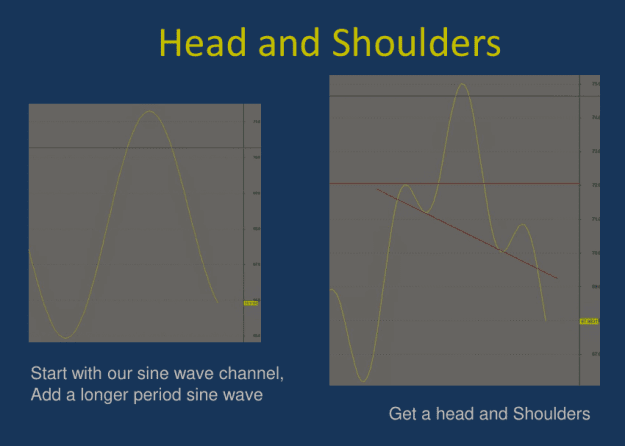
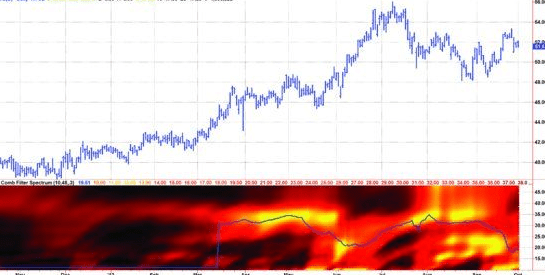
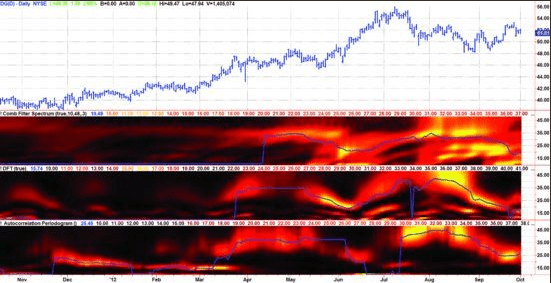
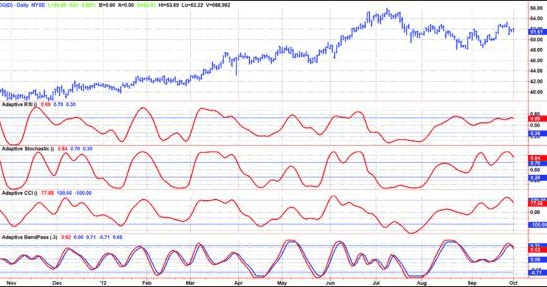
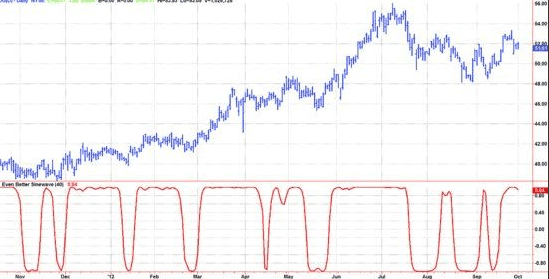
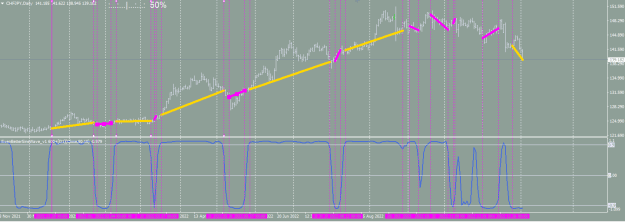
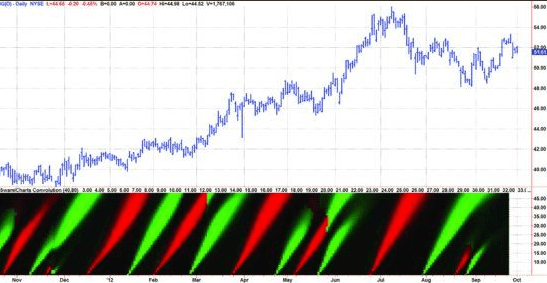
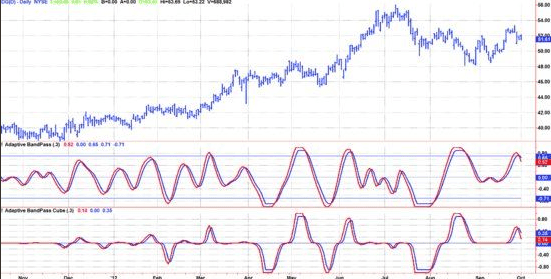
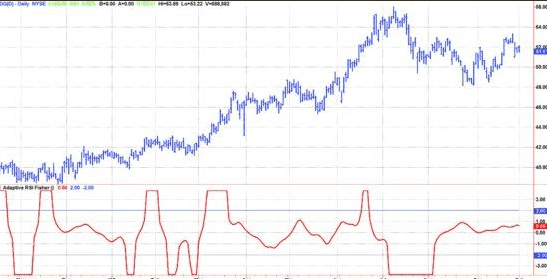
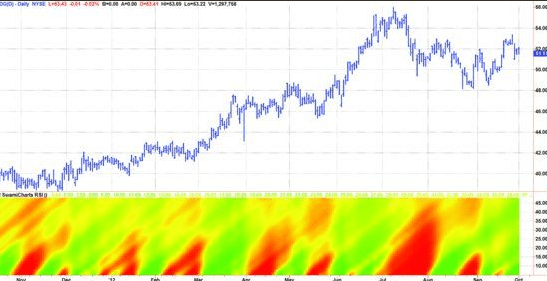
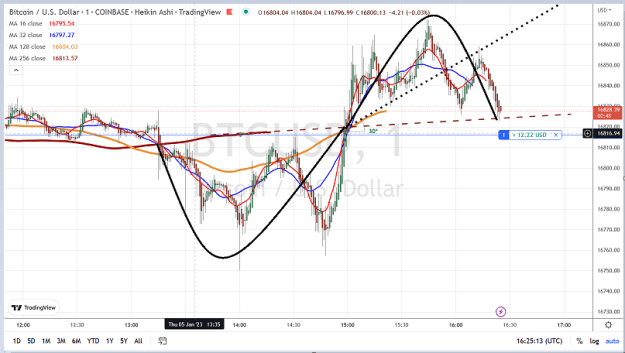
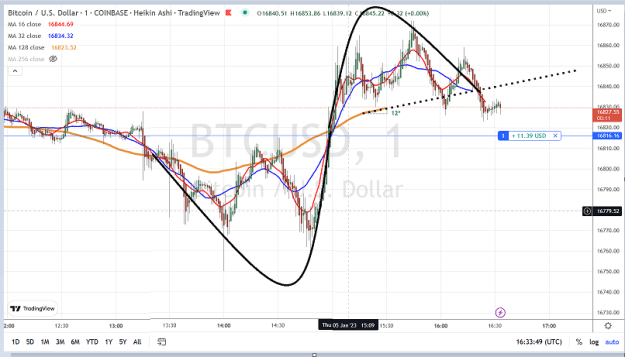
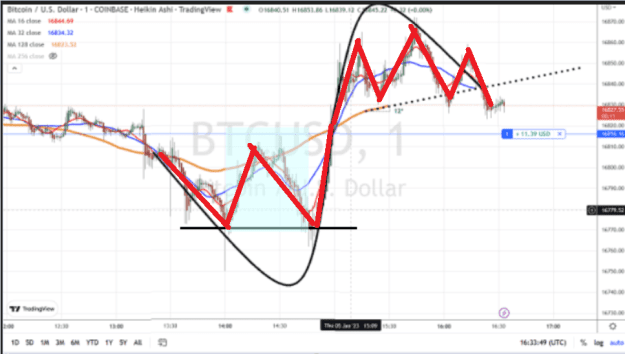
Attached Image (click to enlarge)
1