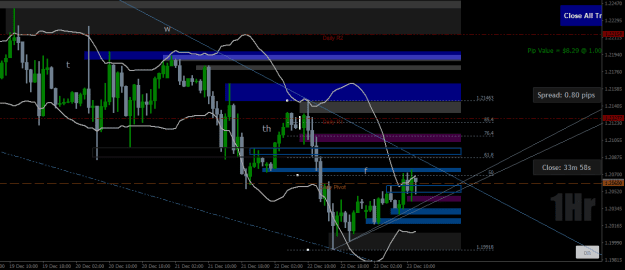
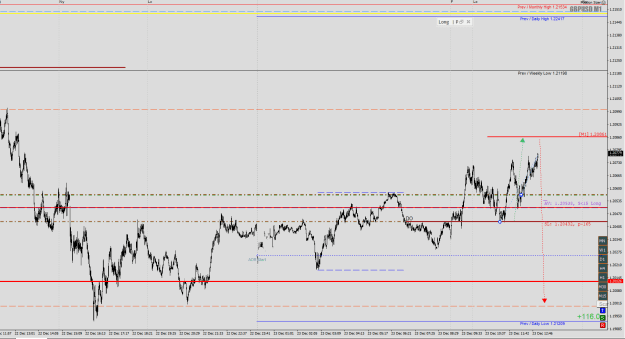
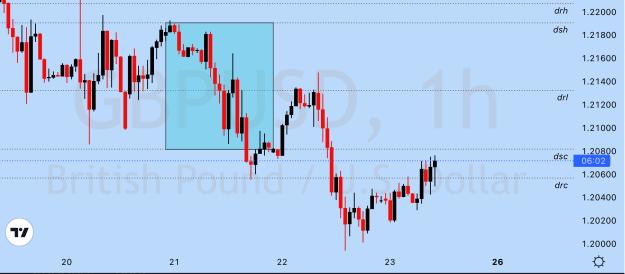
G/M, price has generally continued it's rise from y/day's lo with a couple of pullbacks...the current dly hi being @/around a couple of fibs and at a prev minor 1hr sw lo zone = prev supp = pot sbr.
{quote} IMO yesterday Average daily range (in current ranging market) was met and you still traded that price will extend. Right at that Time I was long (on EU).
Ignored
Sorry to ask you my Newbie question. How does Average daily range measure if price has reached its limit.
I donno how to use it. Can you give me some brief insight how averages measure as price at times is volatile and at times it just calm. I suppose Average daily range measure the past week or days data, how do we know it will measure future movement ?. BTW, what setting do you use for this tools ?.
{quote} Sorry to ask you my Newbie question. How does Average daily range measure if price has reached its limit. I donno how to use it. Can you give me some brief insight how averages measure as price at times is volatile and at times it just calm. I suppose Average daily range measure the past week or days data, how do we know it will measure future movement ?. BTW, what setting do you use for this tools ?. Thank you
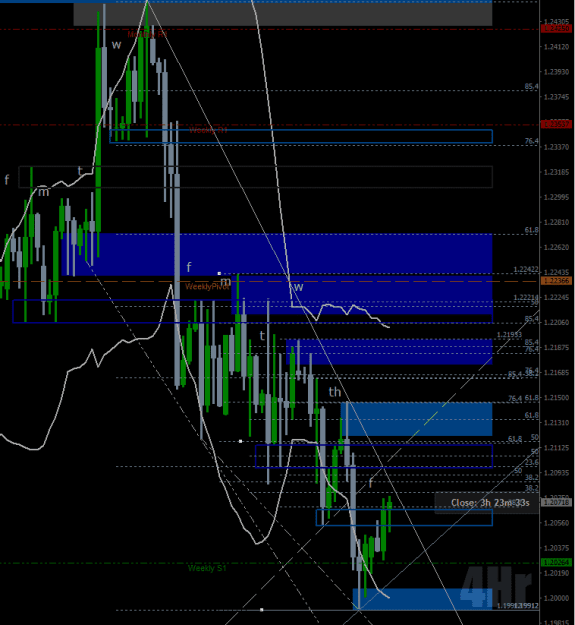
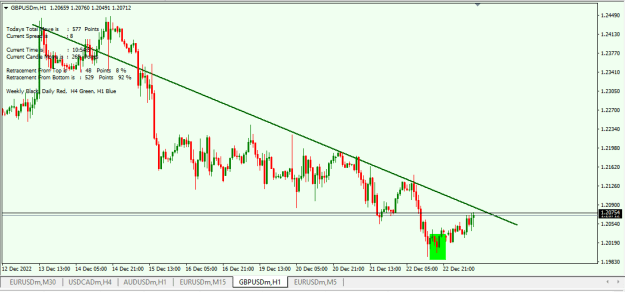
...this prev near-term 1hr/4hr descending rangy channel has proved an obstacle for bulls so they really need to get upside of it, certainly above thurs's hi anyways, to establish any kind of bullish tone on this 4hr t/f. Of course, the channel may prevail, ie a pullback from a LL and then continue south?
...this prev near-term 1hr/4hr descending rangy channel has proved an obstacle for bulls so they really need to get upside of it, certainly above thurs's hi anyways, to establish any kind of bullish tone on this 4hr t/f. Of course, the channel may prevail, ie a pullback from a LL and then continue south? 4hr below {image}
Ignored
Thanks Headland for your very update informative chart to keep me aware what price is doing. I like you sentence " obstacle for bulls" and giving me some hope my short trades will survive.......lets pray on that.
BTW, Today, US PCE inflation data is due today in few hours. The forecast is for core PCE to have increased +0.2% m/m and for the YoY figure to print +4.7% (prev. 5.0%) Important data to reaffirm that inflation has peaked.
Looking forward seeing your analysis and chart everyday. Merry Christmas to you Bro, and enjoy the break...
{quote} Sorry to ask you my Newbie question. How does Average daily range measure if price has reached its limit. I donno how to use it. Can you give me some brief insight how averages measure as price at times is volatile and at times it just calm. I suppose Average daily range measure the past week or days data, how do we know it will measure future movement ?. BTW, what setting do you use for this tools ?. Thank you
Ignored
They were just going after your acc / SL. It's made to do this. Most people buy on GBPUSD. So what they do. Trend is down. Most people are buying. They are doing this so buyers will say "Oh, now price will finally go my way". But this never happens. Also for sellers they are on good side BUT they entered too soon. So this way by false move up, they will kill both. Sellers and buyers.
Sorry if explained badly. Hope you got me. Always try to buy on low and sell on high. Lower & higher the better. If you insert 10 pips round numbers on the chart, you'll see it. :o)
I may create new thread about this. If anyone is interested, let me know. We can use small stops that way with high amount of lots.
{quote} Sorry to ask you my Newbie question. How does Average daily range measure if price has reached its limit. I donno how to use it. Can you give me some brief insight how averages measure as price at times is volatile and at times it just calm. I suppose Average daily range measure the past week or days data, how do we know it will measure future movement ?. BTW, what setting do you use for this tools ?. Thank you
Ignored
I am also Newbie:
What I have learned in this year. (I work on EU only)
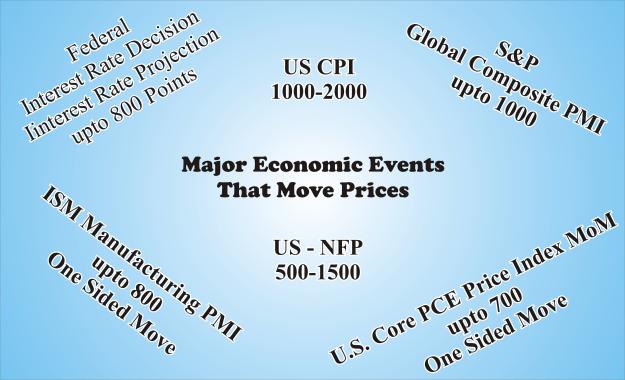
There is always a certain Pips move based on News. If News are "CPI, NFP, FOMC Meeting or Presser, PPI, ISM ***" There is a defined Price Move. How I calculate on the basis of history;
Usual Daily Price move (EU) is 80 Pips
CPI Strong Positive/Negative Data daily move is 150-200 Pips (If data is in the favor of Federal Price move extends other wise price reverses upto 50% or move and always honors Market Sentiment).
If ISM or PCE type data Price move is 100-120 Pips.
This is how I trade, show me the history, where price is not honored rules of Big economies. This is happening every day.
every day when I open my laptop I first see the news, I see historical News Data then I define an expected daily price range. I never follow the trend if daily range is met, I go against the trend.
(My other rule I don't use stop loss, rather I use Stop Order. My win loss ration is more than 3:1. so if stop order triggers, trade is hedged. On next confirmed move, I close the Profit trade and open another trade in right direction. My losing trade closes at BE and My new position gives me some pips) This strategy I learned from my cousin who is professional trader since 2008.
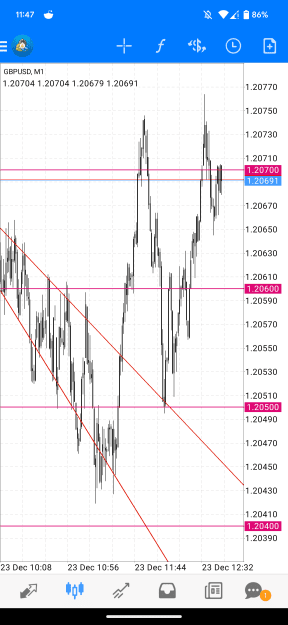
Below image I use to define expected daily move and I am on right side 95% of the times. I said 95%...
{quote} Thanks Headland for your very update informative chart to keep me aware what price is doing. I like you sentence " obstacle for bulls" and giving me some hope my short trades will survive.......lets pray on that. BTW, Today, US PCE inflation data is due today in few hours. The forecast is for core PCE to have increased +0.2% m/m and for the YoY figure to print +4.7% (prev. 5.0%) Important data to reaffirm that inflation has peaked. Looking forward seeing your analysis and chart everyday. Merry Christmas to you Bro,...
Ignored
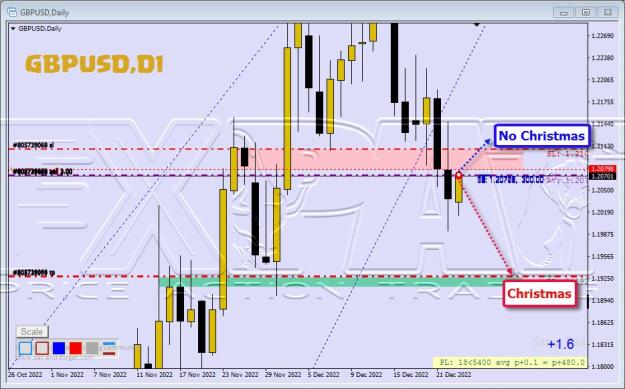
Hi, thankyou for your comments. Compliments of the season to you too. G/L with that short- what with Xmas depending on it (lol!) Agree with comments re U.s Core Pce data.
{quote} I am also Newbie: What I have learned in this year. (I work on EU only) There is always a certain Pips move based on News. If News are "CPI, NFP, FOMC Meeting or Presser, PPI, ISM ***" There is a defined Price Move. How I calculate on the basis of history; Usual Daily Price move (EU) is 80 Pips CPI Strong Positive/Negative Data daily move is 150-200 Pips (If data is in the favor of Federal Price move extends other wise price reverses upto 50% or move and always honors Market Sentiment). If ISM or PCE type data Price move is 100-120 Pips....
Ignored
Thank You Mr.Kashif Hameed,
for making and effort and time to write and explain to me ( it does help me) on the detailed subject above. Need some time to read you post (few times) to be able to digest and fully understand it.
Again, my admire to you for helping newbie here.
جَزَاكَ ٱللَّٰهُ خَيْرًا Jazak Allah Khair (Islamic expression of gratitude meaning "May Allah reward you [with] goodness.")