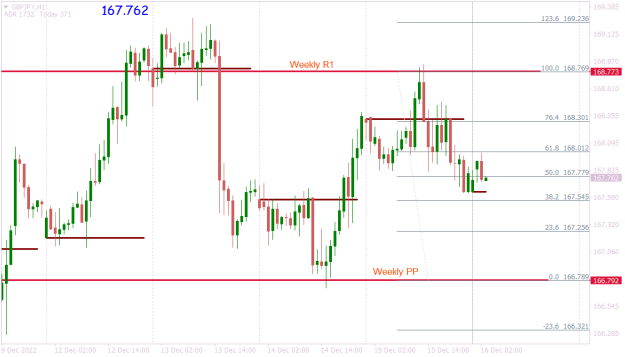
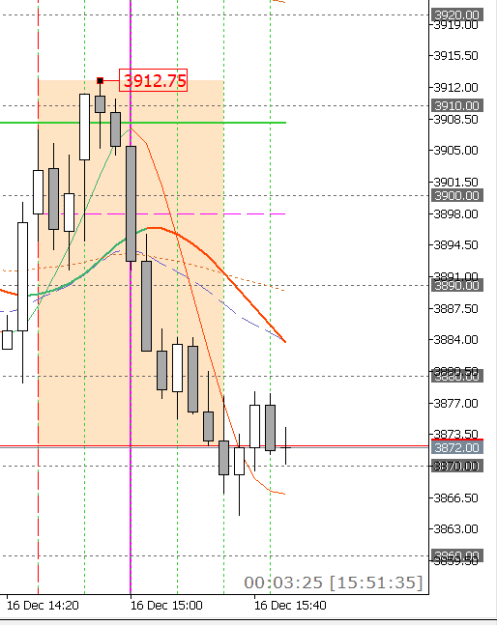
• Home
  • Forums
  • Trades
  • News
  • Calendar
  • Market
  • Brokers
  • Login
  • Join
  • User/Email: Password:
  • 4:10am
Menu
  • Forums
  • Trades
  • News
  • Calendar
  • Market
  • Brokers
  • Login
  • Join
  • 4:10am
Sister Sites
  • Metals Mine
  • Energy EXCH
  • Crypto Craft

Options

Bookmark Thread

First Page First Unread Last Page Last Post

Print Thread

Similar Threads

Equity millipede & Flying Buddha trading journal 9 replies

Flying buddah pattern 20 replies

Build an Equity Millipede with the filtered Flying Buddha 171 replies

Flying buddha pattern 12 replies

16/10/'07 - Crude oil and Greenback flying in opposite directions. 0 replies

  • Trading Discussion
  • /
  • Reply to Thread
  • Subscribe
  • 2,844
Attachments: Flying Dutchman
Exit Attachments
Tags: Flying Dutchman
Cancel

Flying Dutchman

  • Last Post
  •  
  • 1 221222Page 223224225 370
  • 1 Page 223 370
  •  
  • Post #4,441
  • Quote
  • Dec 15, 2022 7:16pm Dec 15, 2022 7:16pm
  •  spzd
  • Joined Dec 2010 | Status: Hybrid PA | 3,448 Posts
Quoting TimeTells
Disliked
(Cheers Mark) This is the same GJ chart, but now "post news spike" as viewed this morning. This chart shows the area (still tradeble imo, as range) where the 'concept' of randomness occurs, you can call it accumulation or whatever, it doesn't matter but it is where both buyers & sellers still in the game are 'trapped' for a better word. Someone will 'cash in' & someone will 'tap out', eventually, and close during this period maybe (frustration, boredom, financial etc), and then the next 'phase' cycle can begin.Repetitive Market Behaviour & Market...
Ignored
Interesting to say the least. Notice how sometimes they leave enough room to trade an inflection point and others they don't. Would love heads up on that.
Mark ... Either you understand or you don't, and that is that.
 
3
  • Post #4,442
  • Quote
  • Dec 15, 2022 7:46pm Dec 15, 2022 7:46pm
  •  TimeTells
  • Joined Dec 2018 | Status: Trading, and Music; that'll do lol | 2,922 Posts
Quoting spzd
Disliked
{quote} Interesting to say the least. Notice how sometimes they leave enough room to trade an inflection point and others they don't. Would love heads up on that.
Ignored

Hi Mark,

I find this market behaviour very interesting also pal.
The news spike in essence took place over just 2 x 5min candles. And the move was nearly 100 pips lol.

Entrapment is "always" my first thought. As once trapped (both buyers & sellers) the larger market has them right where they want them. Frustrated & waiting.

You can see looking at the second chart where breakout traders (initially high & then later low) were quickly put back in their box (literally, lol).

I then "imagine" that when the final aggregate holdings of trades (within that inflection Range) is substantial enough for the market to utilise - then the real breakout will occur.

At present and approaching Xmas & the New Year there may well be less trading volume, although this morning I see (ticks) that there is interest in GJ for "action".

So the larger market held the traders in range till closing last night.
As Asia MUST set the initial high-low for the new trading day we would expect something to occur in the next hour I imagine.
But where & how I don't predict, I just watch with interest what happens.

But the range that was orchestrated last night after the spike, that trapped punters, MUST be broken lol and sometimes they do it both high AND low.
We will have to wait.
 
3
  • Post #4,443
  • Quote
  • Dec 15, 2022 8:03pm Dec 15, 2022 8:03pm
  •  TimeTells
  • Joined Dec 2018 | Status: Trading, and Music; that'll do lol | 2,922 Posts
My last 'random' chart for the morning

A little higher than the Weekly PP at 166.792 on this chart also sits the Monthly PP.

Price sits NOW on the 50% fib of two major ranges.

Which way from now? They will show us eventually (they must imo lol).

(edit: and ps, I am NOT a pivot trader , but I admit I like to watch activity with them )
.
Attached Image (click to enlarge)
Click to Enlarge

Name: GBPJPYH1 random.png
Size: 17 KB
 
4
  • Post #4,444
  • Quote
  • Dec 15, 2022 8:08pm Dec 15, 2022 8:08pm
  •  spzd
  • Joined Dec 2010 | Status: Hybrid PA | 3,448 Posts
Quoting TimeTells
Disliked
{quote} Hi Mark, I find this market behaviour very interesting also pal. The news spike in essence took place over just 2 x 5min candles. And the move was nearly 100 pips lol. Entrapment is "always" my first thought. As once trapped (both buyers & sellers) the larger market has them right where they want them. Frustrated & waiting. You can see looking at the second chart where breakout traders (initially high & then later low) were quickly put back in their box (literally, lol). I then "imagine" that when the final aggregate holdings of trades (within...
Ignored
Ah yes, the red data spike. Learning to trade the aftermath of those spikes is the best I can do. Especially since most breakouts seem to be a result of the red data. A reason to move things.

The only predicting I do is when I enter a trade. Other than that I could really care less to try and predict any moves. Someone once said retail traders need to predict to try and validate their efforts. Professionals just trade the market.
Mark ... Either you understand or you don't, and that is that.
 
3
  • Post #4,445
  • Quote
  • Dec 15, 2022 8:22pm Dec 15, 2022 8:22pm
  •  TimeTells
  • Joined Dec 2018 | Status: Trading, and Music; that'll do lol | 2,922 Posts
And the real two pieces of beauty for me with the Lines
(which are merely price shown in a horizontal format hehee)

from my observations only (with some maths thrown in lol)

is one
that the Lines are always known in ADVANCE

and two
volume (generally) follows them, afterwards

The larger market will leave its footprint, and it must apparently follow at some point to the next.

How it achieves this is (again only imho) by a trade aggregating activity that often seems to throw traders out of whack and out of their comfort zone.
Once that activity can be observed, a trader can utilise market behaviour hopefully to their advantage.

All the best to all, I will likely close my books for the month on Monday, and then enjoy the ensuing festive period as best I can.

Trade well, trade safe (especially next week)
 
4
  • Post #4,446
  • Quote
  • Dec 15, 2022 8:49pm Dec 15, 2022 8:49pm
  •  whitesta
  • | Joined Aug 2018 | Status: Member | 337 Posts
Quoting TimeTells
Disliked
My last 'random' chart for the morning A little higher than the Weekly PP at 166.792 on this chart also sits the Monthly PP. Price sits NOW on the 50% fib of two major ranges. Which way from now? They will show us eventually (they must imo lol). (edit: and ps, I am NOT a pivot trader , but I admit I like to watch activity with them ) . {image}
Ignored
Hi Timetells, which pivot indicator do you use?

Regards
 
 
  • Post #4,447
  • Quote
  • Dec 15, 2022 8:50pm Dec 15, 2022 8:50pm
  •  spzd
  • Joined Dec 2010 | Status: Hybrid PA | 3,448 Posts
Quoting TimeTells
Disliked
And the real two pieces of beauty for me with the Lines (which are merely price shown in a horizontal format hehee) from my observations only (with some maths thrown in lol) is one that the Lines are always known in ADVANCE and two volume (generally) follows them, afterwards The larger market will leave its footprint, and it must apparently follow at some point to the next. How it achieves this is (again only imho) by a trade aggregating activity that often seems to throw traders out of whack and out of their comfort zone. Once that activity...
Ignored
Hate to break the sad news to the delta boys.

Two ways to trade safe. 1) don't take a trade 2) trade smaller
Mark ... Either you understand or you don't, and that is that.
 
2
  • Post #4,448
  • Quote
  • Edited 9:44pm Dec 15, 2022 9:31pm | Edited 9:44pm
  •  TimeTells
  • Joined Dec 2018 | Status: Trading, and Music; that'll do lol | 2,922 Posts
Quoting whitesta
Disliked
{quote}
Hi Timetells, which pivot indicator do you use? Regards
Ignored

Hi W, I use a MetaQuotes Copyrighted indi (so I wont post it)
called “mod hesron” which should be around the traps somewhere.
(edit: called Confluence - mod hesron, mine is slightly larger kb than the std so I might have modified mine myself later, as I can program - well edit/copy/paste lol)


But please, all.

I must point out, as I always do lol,
ALL indis etc work half the time for their intended purpose (50%) and therefore half the time - they DON’T.

So, imho, a trader should not use an indi as a signal TO trade. I found for me it was best to wait & observe what other traders & the larger market does around them (and from them & to them) is the “safest” way, well for me.

But having said that I still reckon I could use ANY indi out there (yep any one lol ) and then throw it on top of my main chart template and “find a way” to implement that indi into my VIEW of the current market structure & behaviour.


So please traders (all traders) my suggestion is do not use any forex mt4 indi as THE signal to initiate a trade. Observe what the market does at that indi maybe and if you can put its 50% probability then into a “higher” percentage of probability, then you might have a trade imminent.

Only each trader can determine this all for themselves. Somewhere, I always imagine to myself, some other trader is losing on the ‘same” area setup. Think about that please.

Trade well, trade safe all.
 
4
  • Post #4,449
  • Quote
  • Dec 15, 2022 11:26pm Dec 15, 2022 11:26pm
  •  bluesteele
  • Joined Aug 2007 | Status: Member | 1,759 Posts
Quoting TimeTells
Disliked
And the real two pieces of beauty for me with the Lines (which are merely price shown in a horizontal format hehee) from my observations only (with some maths thrown in lol) is one that the Lines are always known in ADVANCE and two volume (generally) follows them, afterwards The larger market will leave its footprint, and it must apparently follow at some point to the next. How it achieves this is (again only imho) by a trade aggregating activity that often seems to throw traders out of whack and out of their comfort zone. Once that...
Ignored
Hi Pete..... Funny enough your post got me to thinking of the chart I shared the other day.
https://www.forexfactory.com/thread/...1#post14255201

What I didnt share was just a further breakdown of that chart and its patterns of TIME and PRICE revolving around the 3912.50 level...

I am predominantly a short term daytrader only a few trades per day when I stick to my plan But I think its important to look at the bigger picture,,,,as we all know the market is Fractal.... I recall chatting with George on using the Higher TFs such as the daily or 4hr to execute trades on the 5m or 1m and of course we can do that with practice and experience.

Anyhoo yes lines are known in Advance,,,3912.50 as a Biggy on the ES SPX indice.... Whats also known is the prior swings both in timing length and in price....
So now we have A Line (equilibrium) 3912.50 we have an Impulsive move down of 823.5pts over 37 Bars followed by a corrective swing of 685 pts and 40 bars...

Now back to your "The larger market will leave its footprint, and it must apparently follow at some point to the next."

I have intentionally left out some other information(technical) info on the chart to leave more room for thought...

Just a random chart of a random market....with random levels random times random swings random prices and even some random volume for fun as I dont want to leave anyone out


Cheers
Blue

Attached Image (click to enlarge)
Click to Enlarge

Name: ES1!_2022-12-15_TIMING_PRICE_FORECAST.png
Size: 70 KB
The Best Loser Wins
 
5
  • Post #4,450
  • Quote
  • Dec 16, 2022 1:16am Dec 16, 2022 1:16am
  •  bluesteele
  • Joined Aug 2007 | Status: Member | 1,759 Posts
Quoting TimeTells
Disliked
And the real two pieces of beauty for me with the Lines (which are merely price shown in a horizontal format hehee) from my observations only (with some maths thrown in lol) is one that the Lines are always known in ADVANCE and two volume (generally) follows them, afterwards The larger market will leave its footprint, and it must apparently follow at some point to the next. How it achieves this is (again only imho) by a trade aggregating activity that often seems to throw traders out of whack and out of their comfort zone. Once that...
Ignored
Ahh Pete here we go again ! .....Lines are always known in advance...love it....

A chart is a chart whatever the asset it does not matter...Charts are nothing but a representation of rational human behaviour...
Always think where is the money? where are traders trapped..where is the liquidity...Where are the voids the imbalances
the displacements...How does it all line up with the psychology of the charts... Im buying your selling and vice versa....
Human interaction that we perceive with our own reasoning (psychology)..

Then we have the market makers the Algos ..The Algo etc that use Time and Price to manipulate what we see..
fore they know what and how we/most think.. Humans as a group are highly predictable thus they know our behaviours and tendencies very well.

So now back to lines are always known in advance....Using a high TF for levels to enter on a short tf....
sort of a rare bird to execute this.
But it really just needs focus on the details with the big picture and bring that down to the 1 or the 5 and execute on timings and the higher tf levels as they are the same on a 1min chart or a 15 sec chart..its a hard number.
Timing and levels dont change never.....Thats what we exploit,,

So another couple of charts for some thought hope it helps someone

Cheers
Blue


Attached Image (click to enlarge)
Click to Enlarge

Name: ES1!_2022-12-15_FOMC breakdown 4hr chart.png
Size: 98 KB
Attached Image (click to enlarge)
Click to Enlarge

Name: ES1!_2022-12-15_FOMC breakdown 1min chart.png
Size: 91 KB
The Best Loser Wins
 
7
  • Post #4,451
  • Quote
  • Dec 16, 2022 9:50am Dec 16, 2022 9:50am
  •  Shabs19
  • Joined Aug 2006 | Status: Member | 3,945 Posts
Quoting bluesteele
Disliked
{quote} Ahh Pete here we go again ! .....Lines are always known in advance...love it.... A chart is a chart whatever the asset it does not matter...Charts are nothing but a representation of rational human behaviour... Always think where is the money? where are traders trapped..where is the liquidity...Where are the voids the imbalances the displacements...How does it all line up with the psychology of the charts... Im buying your selling and vice versa.... Human interaction that we perceive with our own reasoning (psychology).. Then we have the...
Ignored
Absolutely agree with all your points Blue,

I also look at the bigger picture for Market Structure, look for where the whales are entering the market.

Daily shows MS @ 4123 13th Sept. which is tested on the 14th Dec.

If you go to the 1hr Chart, to the 13th Dec USD CPI News Event (1hr chart) @ 13:00 followed by a massive imbalance & correction @ 15:00 GMT

creating an FVG between 4094 - 4044,

On the 14th Dec price clawed back into FVG with Doji candle (Early Warning) , showing weakness of the Bulls @ 16:00 and took in Longs right up to the FOMC News. You could have taken the Short trade an hour before the News below the last last fractal low.
Follow the Money
 
4
  • Post #4,452
  • Quote
  • Dec 16, 2022 10:44am Dec 16, 2022 10:44am
  •  bluesteele
  • Joined Aug 2007 | Status: Member | 1,759 Posts
Nice bounce off 3912.50 to start the day short.
The Best Loser Wins
 
2
  • Post #4,453
  • Quote
  • Dec 16, 2022 10:56am Dec 16, 2022 10:56am
  •  spzd
  • Joined Dec 2010 | Status: Hybrid PA | 3,448 Posts
Quoting bluesteele
Disliked
Nice bounce off 3912.50 to start the day short.
Ignored

Attached Image (click to enlarge)
Click to Enlarge

Name: MESH23-2022-12-16_095150.png
Size: 9 KB
Mark ... Either you understand or you don't, and that is that.
 
3
  • Post #4,454
  • Quote
  • Dec 16, 2022 11:23am Dec 16, 2022 11:23am
  •  Shabs19
  • Joined Aug 2006 | Status: Member | 3,945 Posts
Quoting spzd
Disliked
{quote} {image}
Ignored
That is very strange, the chart is 5m SP500 right ? I have the exact sequence of candles as shown above.

I am getting the High @ 3881 on Pepperstone & IG Markets MT4

Previous Days Low & Monthly Open @ 3878

Weird.
Follow the Money
 
2
  • Post #4,455
  • Quote
  • Dec 16, 2022 1:04pm Dec 16, 2022 1:04pm
  •  bluesteele
  • Joined Aug 2007 | Status: Member | 1,759 Posts
Quoting Shabs19
Disliked
{quote} That is very strange, the chart is 5m SP500 right ? I have the exact sequence of candles as shown above. I am getting the High @ 3881 on Pepperstone & IG Markets MT4 Previous Days Low & Monthly Open @ 3878 Weird.
Ignored
Just the difference between the CFD and Emini futures pricing is all... But yes same candles..slightly diff pricing..

I trade cfds but use the Emini chart for analysis.
On another thought is the ES Emini futures contracts are priced $12.50 per 0.25 tick four ticks to a point= $50 /point...

So the ES charts work in 0.25 increments...
And what I do is pay particular attention to the numbers specific to the ES for ex...
4000 4012.50 4025 4037.50 4050 4062.50.4075 4087.50 etc ... So round numbers and the numbers that correlate to the pricing per tick... 12.50

I've posted I believe a chart of the ES with those numbers highlighted a number of posts ago... Anyways
Bit of a side tour from the original question LoL...

Just something that I never see talked about but IMO is quite important... Just look at the 3912.50 level...

Cheers all
Blue
The Best Loser Wins
 
3
  • Post #4,456
  • Quote
  • Dec 16, 2022 1:12pm Dec 16, 2022 1:12pm
  •  turnip15
  • Joined Sep 2006 | Status: Member | 9,008 Posts
Quoting Shabs19
Disliked
{quote} Absolutely agree with all your points Blue, I also look at the bigger picture for Market Structure, look for where the whales are entering the market. Daily shows MS @ 4123 13th Sept. which is tested on the 14th Dec. If you go to the 1hr Chart, to the 13th Dec USD CPI News Event (1hr chart) @ 13:00 followed by a massive imbalance & correction @ 15:00 GMT creating an FVG between 4094 - 4044, On the 14th Dec price clawed back into FVG with Doji candle (Early Warning) , showing weakness of the Bulls @ 16:00 and took in Longs right up to the...
Ignored
Oh no !!! More homework
Seriously - love to study this stuff albeit not sure yet about FVGaps
every Saint has a past. Every Sinner has a Future
 
 
  • Post #4,457
  • Quote
  • Dec 16, 2022 1:23pm Dec 16, 2022 1:23pm
  •  turnip15
  • Joined Sep 2006 | Status: Member | 9,008 Posts
Quoting Shabs19
Disliked
{quote} Absolutely agree with all your points Blue, I also look at the bigger picture for Market Structure, look for where the whales are entering the market. Daily shows MS @ 4123 13th Sept. which is tested on the 14th Dec. If you go to the 1hr Chart, to the 13th Dec USD CPI News Event (1hr chart) @ 13:00 followed by a massive imbalance & correction @ 15:00 GMT creating an FVG between 4094 - 4044, On the 14th Dec price clawed back into FVG with Doji candle (Early Warning) , showing weakness of the Bulls @ 16:00 and took in Longs right up to the...
Ignored
The bearish FVG - is that where the "sniper short" is indicated ( FVG - then price went down, then came back into FVG level and sank for a nice short) ?
every Saint has a past. Every Sinner has a Future
 
 
  • Post #4,458
  • Quote
  • Dec 16, 2022 1:30pm Dec 16, 2022 1:30pm
  •  spzd
  • Joined Dec 2010 | Status: Hybrid PA | 3,448 Posts
Quoting Shabs19
Disliked
{quote} That is very strange, the chart is 5m SP500 right ? I have the exact sequence of candles as shown above. I am getting the High @ 3881 on Pepperstone & IG Markets MT4 Previous Days Low & Monthly Open @ 3878 Weird.
Ignored
That is the March micro e-mini. What you have is the CFD which I believe gives the cash price.

As far as the bars, they are nearly identical. Even more curious, take a look at any US equity index and they will all be essentially the same. Dow and Nasdaq have larger moves within the same bar patterns.
Mark ... Either you understand or you don't, and that is that.
 
 
  • Post #4,459
  • Quote
  • Edited 4:24pm Dec 16, 2022 1:55pm | Edited 4:24pm
  •  turnip15
  • Joined Sep 2006 | Status: Member | 9,008 Posts
Quoting bluesteele
Disliked
{quote} Just the difference between the CFD and Emini futures pricing is all... But yes same candles..slightly diff pricing.. I trade cfds but use the Emini chart for analysis. On another thought is the ES Emini futures contracts are priced $12.50 per 0.25 tick four ticks to a point= $50 /point... So the ES charts work in 0.25 increments... And what I do is pay particular attention to the numbers specific to the ES for ex... 4000 4012.50 4025 4037.50 4050 4062.50.4075 4087.50 etc ... So round numbers and the numbers that correlate to the pricing...
Ignored
Example of problem I have with FVGaps
Price goes up to MA200 line then drops through UK open lane and nearby level. "B" is a FVG but doesn't count because it hasn't broke a structural level/point?
Then price structure is broken at "A" . Price then forms a FVGap at "C" but I cannot see a return to that FVGap to trigger a short.
But my "Roadmap" approach does trigger a short?
Have I misread the FVGap at "C" or FVGaps in general?
Anyone ?
Attached Image (click to enlarge)
Click to Enlarge

Name: US500_2022-12-16_18-49-14_396f0.png
Size: 133 KB
every Saint has a past. Every Sinner has a Future
 
1
  • Post #4,460
  • Quote
  • Dec 16, 2022 2:35pm Dec 16, 2022 2:35pm
  •  Shabs19
  • Joined Aug 2006 | Status: Member | 3,945 Posts
Quoting bluesteele
Disliked
{quote} Just the difference between the CFD and Emini futures pricing is all... But yes same candles..slightly diff pricing.. I trade cfds but use the Emini chart for analysis. On another thought is the ES Emini futures contracts are priced $12.50 per 0.25 tick four ticks to a point= $50 /point... So the ES charts work in 0.25 increments... And what I do is pay particular attention to the numbers specific to the ES for ex... 4000 4012.50 4025 4037.50 4050 4062.50.4075 4087.50 etc ... So round numbers and the numbers that correlate to the pricing...
Ignored
Potato / Patato again ?
Follow the Money
 
3
  • Trading Discussion
  • /
  • Flying Dutchman
  • Reply to Thread
    • 1 221222Page 223224225 370
    • 1 Page 223 370
4 traders viewing now
  • More
Top of Page
  • Facebook
  • Twitter
About FF
  • Mission
  • Products
  • User Guide
  • Media Kit
  • Blog
  • Contact
FF Products
  • Forums
  • Trades
  • Calendar
  • News
  • Market
  • Brokers
  • Trade Explorer
FF Website
  • Homepage
  • Search
  • Members
  • Report a Bug
Follow FF
  • Facebook
  • Twitter

FF Sister Sites:

  • Metals Mine
  • Energy EXCH
  • Crypto Craft

Forex Factory® is a brand of Fair Economy, Inc.

Terms of Service / ©2023