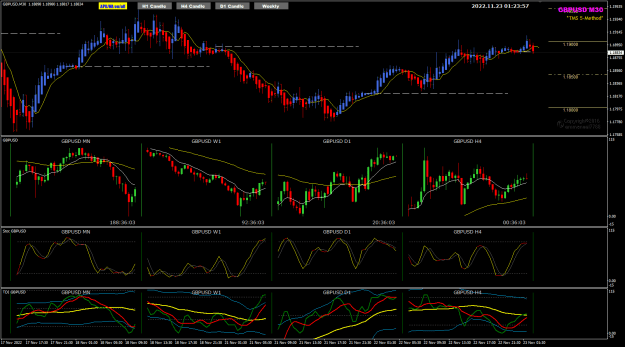
Disliked{quote} As image show Dave, made all sell entries on M5 TDI crossover / bounce sell setup's. As you mentioned all entries was against M15<>H4. That was today, tomorrow D1 can go up with M15<>H4 going down. Find it difficult to look at all the time frames for each one's own TDI green can be in the opposite direction to the next higher time frame. > It comes down to which higher timeframe is the so called "Boss" timeframe that will make you close a bad trade taken on a lower time frame.Ignored
That is exactly the point that I am making! If you decide that D1 is controlling the direction, at SOME point in time, EVERY TF below it is going to make its RETRACEMENT to that D1 direction. And when a TF makes its retracement, EVERY TF below it is going to make its retracement to that bigger retracement TF. Few people understand how this FRACTAL-like nature of financial time series is expressed in these retracement-continuation cycles, and make entry decisions based on insufficient information about which TF to FOCUS on for entries and which TF is the direction CONTROL TF.
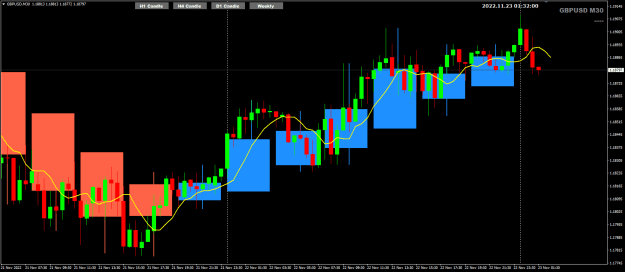
And when that retracement is on a larger enough TF, it will SEEM like "the market" has reversed, but in reality, it is simply a TF smaller than D1 in a retracement.
With that said, when the retracement TF is big enough, then you CAN trade that retracement. But you must keep in mind that it is a RETRACEMENT, and is more likely to FAIL to act like a trend continuation swing acts. Unfortunately for most retail traders, they have NO CLUE that it is a retracement, but see it as a trend change, and then wonder why it stopped short or suddenly reversed, ate the SL, and just continued on its merry way, leaving the bewildered trader thinking, "WTF just happened?!? How could the market reverse AGAIN when it just reversed??" Well, because the market did not reverse before, but simply did a retracement. And this "second reversal" was no reversal at all, but simply a trend continuation.
To free Gazans of Hamas, use whatever it takes.