do not follow me 99.9999999% of times, rest you can lol
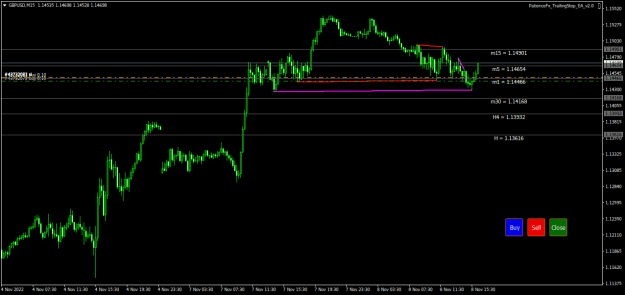
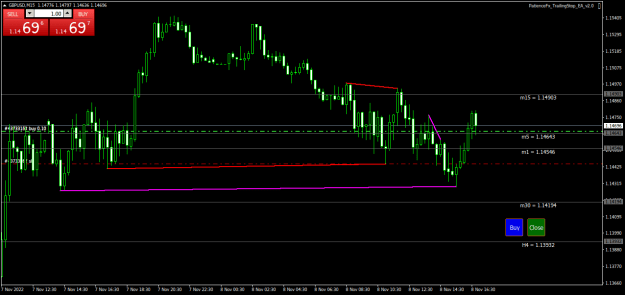
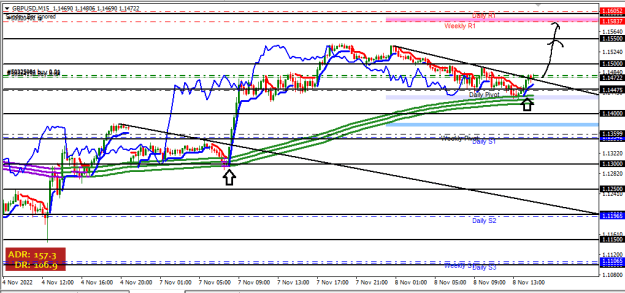
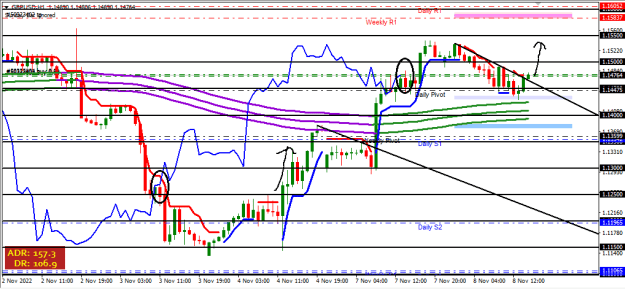
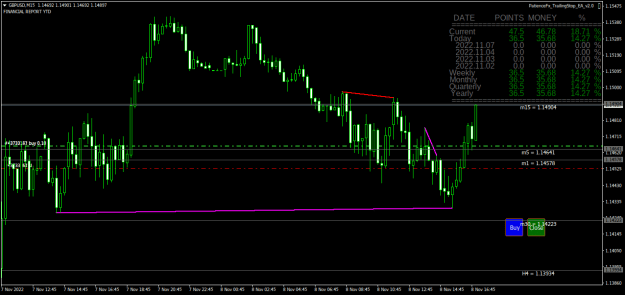
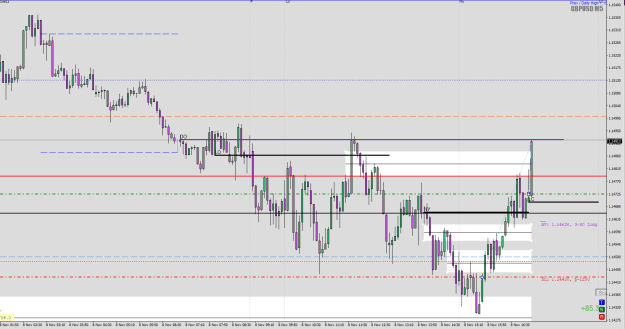
 Cable Update (GBPUSD)
- #705,021
- Nov 8, 2022 8:28am Nov 8, 2022 8:28am
- Joined Jun 2013 | Status: enjoying life | 23,994 Posts
- #705,022
- Nov 8, 2022 8:33am Nov 8, 2022 8:33am
- Joined Apr 2020 | Status: Offline | 3,298 Posts

"Exchange of hands"
- #705,026
- Nov 8, 2022 8:36am Nov 8, 2022 8:36am
- Joined Sep 2017 | Status: Trader | 4,369 Posts
Trade to trade another day
- #705,027
- Nov 8, 2022 8:38am Nov 8, 2022 8:38am
- Joined Apr 2020 | Status: Offline | 3,298 Posts
"Exchange of hands"
- #705,028
- Nov 8, 2022 8:38am Nov 8, 2022 8:38am
- Joined Sep 2017 | Status: Trader | 4,369 Posts
Trade to trade another day
- #705,031
- Nov 8, 2022 8:50am Nov 8, 2022 8:50am
- Joined Jul 2007 | Status: Trader | 17,796 Posts
COT: The precious data ignored
- #705,033
- Nov 8, 2022 9:00am Nov 8, 2022 9:00am
- Joined Jun 2013 | Status: enjoying life | 23,994 Posts
do not follow me 99.9999999% of times, rest you can lol
- #705,034
- Nov 8, 2022 9:06am Nov 8, 2022 9:06am
- Joined Jun 2013 | Status: enjoying life | 23,994 Posts
do not follow me 99.9999999% of times, rest you can lol
- #705,035
- Nov 8, 2022 9:08am Nov 8, 2022 9:08am
- Joined Dec 2017 | Status: Trader | 30,688 Posts
yes yes yes
- #705,036
- Nov 8, 2022 9:09am Nov 8, 2022 9:09am
- Joined Jun 2013 | Status: enjoying life | 23,994 Posts
do not follow me 99.9999999% of times, rest you can lol
- #705,037
- Nov 8, 2022 9:10am Nov 8, 2022 9:10am
- Joined Apr 2020 | Status: Offline | 3,298 Posts
"Exchange of hands"
- #705,038
- Nov 8, 2022 9:12am Nov 8, 2022 9:12am
- | Commercial User | Joined Jul 2021 | 3,280 Posts
My telegram: https://t.me/avidforex
- #705,039
- Nov 8, 2022 9:12am Nov 8, 2022 9:12am
- Joined Apr 2020 | Status: Offline | 3,298 Posts
"Exchange of hands"
- #705,040
- Nov 8, 2022 9:12am Nov 8, 2022 9:12am
- Joined May 2017 | Status: Intermediate Trader | 6,436 Posts
Extreme gut feeling trader