Joined Aug 2018
|
Status: Research Analyst
|4,295 Posts
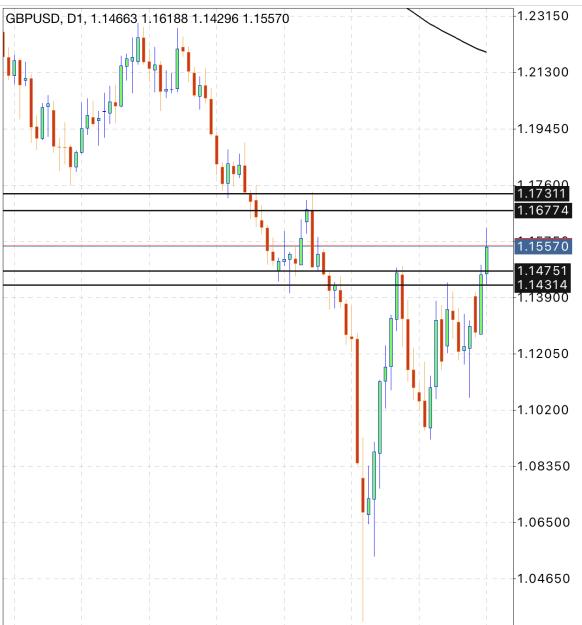
Third sell from 1.1570 and second sell from 1.1513 removed at 1.1550 ... + 20 and - 37 pips... Only one sell left....
If today's range is going to be another 220 pips, then I will short heavy from 1.1650, if it doesn't get there, my sell from 1.1330 will be recovering, forced to switch to swing...
{quote} With the Housing market plummeting, Bro, The probability we will see a weak US GDP figure increase?
Ignored
New Housing construction is a small part of GDP. The Fed is still trying to pull an 8% increase down to 2% and there is nothing that they do short of massive cutting of money supply that will achieve it. The other choice is just to wait for the previous changes to be absorbed by the system so that the problem effectively disappears.
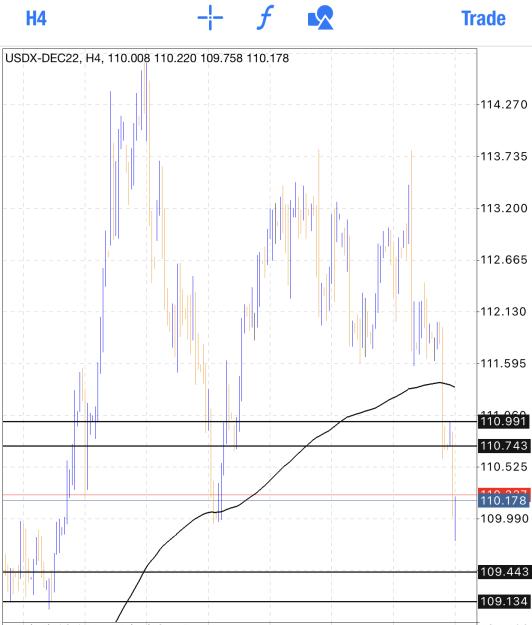
{quote} I don't know if this thing is ready to correct that much this week based on the weekly and daily charts. The USDX just broke a solid support at 109.88 which signal a move to 108.00. Probably a slight correction down to 1.15 - 1.1450 and up by Friday IMO. We'll see.
Ignored
Like I said earlier, im expecting 130 to 400 pips correction from whichever high it makes...
Note that since 1.1495 high got broken, it will have to break it by 200 pips, which means there is possibility of price attacking 1.1695 /1.1700, which means weekly range will have to cover 450 pips as it did last 2 and 3 weeks ago.
{quote} New Housing construction is a small part of GDP. The Fed is still trying to pull an 8% increase down to 2% and there is nothing that they do short of massive cutting of money supply that will achieve it. The other choice is just to wait for the previous changes to be absorbed by the system so that the problem effectively disappears. https://www.nahb.org/news-and-econom...mestic-product
Ignored
another pointless opinion.
the fundamental will never be good.
Extreme high for AU is around 0.7700 while extreme low for GU is around 1.0850 according to the law of vibration and they normally correlate
Ignored
I have finally closed GU with tiny profits and going long AU. REason: It is in a more advanced phase. GU surpassed 1.1575 a bit and be both will be right going long and short but took the AU option
{quote} New Housing construction is a small part of GDP. The Fed is still trying to pull an 8% increase down to 2% and there is nothing that they do short of massive cutting of money supply that will achieve it. The other choice is just to wait for the previous changes to be absorbed by the system so that the problem effectively disappears. https://www.nahb.org/news-and-econom...mestic-product
Ignored
Thanks
More time in the market, does not mean you trade better!
{quote} I have a question please Mr Wolf. In your chart (below) I have marked the S/R area that you mention (is that right?) "1" and "2". In the time where I marked "1", it looks like the price was in and around that area for 2 weeks at the most, probably less. In the area of "2" the price was there for another 2 or maybe 3 weeks at the most, maybe less. Assuming that no news items blast through this area, is this a possible area and time for consolidation do you think? I won't hold you to it (hahaha) but I am interested to see if this might be...
Ignored
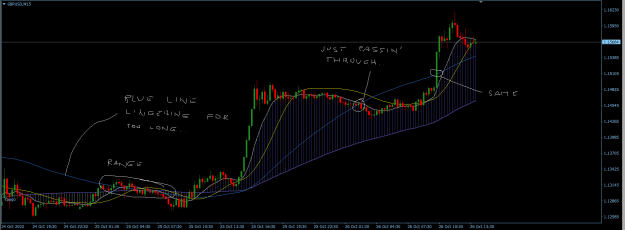
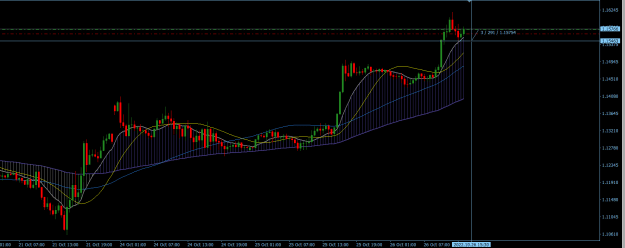
Hmm, good observation! Could very well be yeah. Although for any consolidation for example, this is where blue line comes in play. On Weekly Chart it's too far unfortunately, but it's very useful on lower TF's. Whenever this Blue line get's close to the candles, it's always a sign for concern because if it lingers within candles for longer then it should, then it means that what we will have is probably price ranging and some type of consolidation.
For example..
Okay, this is a 15M Chart now on GBP/USD.
I didn't actually realize that price was around this price for a longer period of time, nice catch.
But to answer the question, honestly I don't know.. If we get any longer period consolidation this blue line will warn me on time.
I know I didn't help much, but yeah.. could be.
However, one reason why I don't think the price will linger on these prices for too long is because of very big news we have especially for this pair in these two, three weeks now.
Now that market has settled down for a while, I want to say thank you to those who have helped me to get my silly head in the right place over the past few weeks. You know I won't mention names, but you know who you are. I am trying to book (I like that word!) +25 per day to have a chance to make my account really big in a year from now. I have a nice job and don't wish to stop working at it. But if I can get +25 average per day, I will have a nice nest egg. Some days I can make more, some days less, but average is important. To make a zillion...
Ignored
25 pips a day is very manageable... I see these 20$-52,000$ challenges on youtube with just 20-25 pips... Its interesting to say the least...
{quote} Hmm, good observation! Could very well be yeah. Although for any consolidation for example, this is where blue line comes in play. On Weekly Chart it's too far unfortunately, but it's very useful on lower TF's. Whenever this Blue line get's close to the candles, it's always a sign for concern because if it lingers within candles for longer then it should, then it means that what we will have is probably price ranging and some type of consolidation. For example.. Okay, this is a 15M Chart now on GBP/USD. I didn't actually realize that price...
Ignored
That's interesting Mr Wolf, thank you very much. I don't know why I thought of this, but generally speaking I would not expect a sudden reversal at a strong S/R line unless there was some earth shattering news for example! I have seen candles hang around a S/R line for quite some time before they decide to bounce off or crash though. I just wondered if S/R lines that are well known would be a likely place for consolidation. It sounds logical to me, but I don't know enough about it to decide! As you say though, we shall see
I am neither brave nor stupid...I am just a part time trader