Disliked{quote} Yes i know what you mean about head hurting. Sometimes it will be clear as day then other times you blink and now you become lost. Its so hard to not over complicate things too. For me i really like using the H1 as an overall daily direction and will trade in line with it. I then wait for price to come back to what i call zone areas on the H1. From that move on when it makes new highs is when i look at smaller zone areas on the m5 as continuation/road map entries. And to Further complicate things i some times enter on the m1 based on the...Ignored
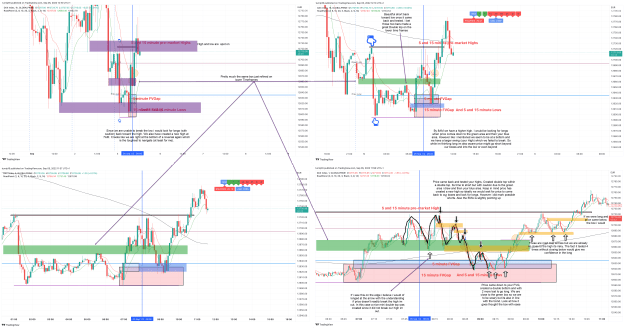
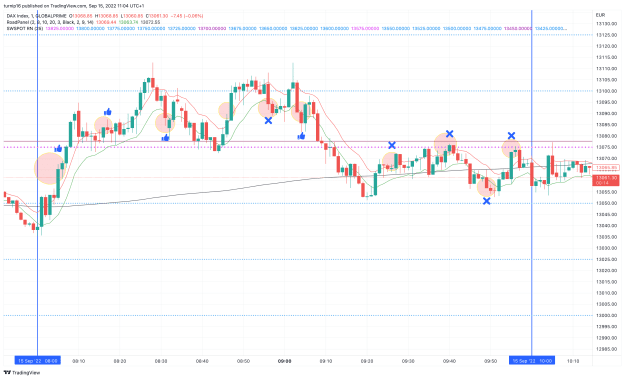
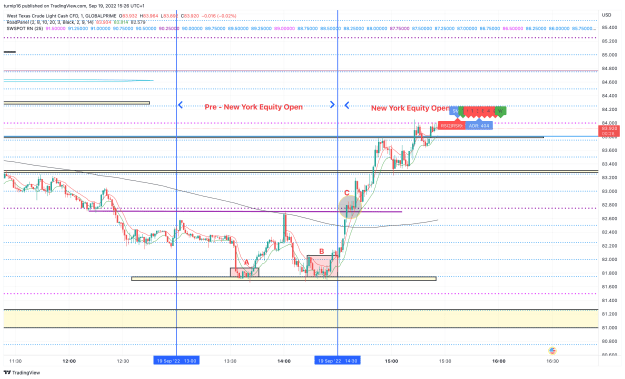
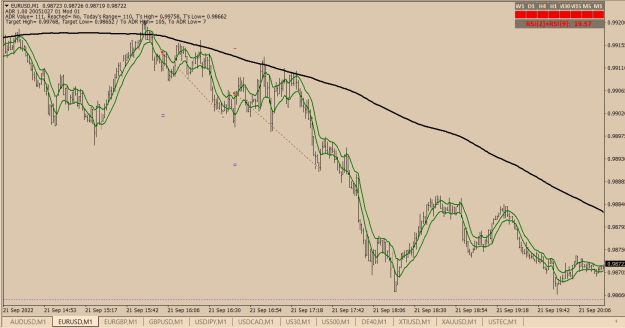
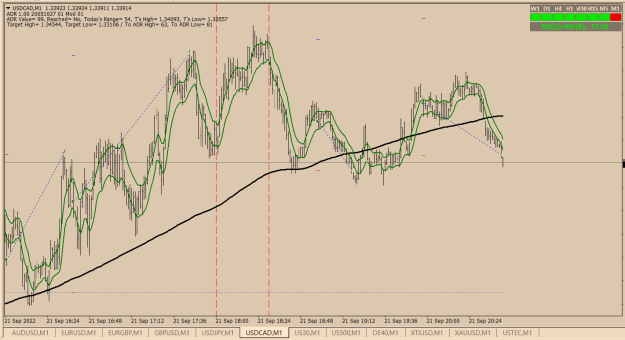
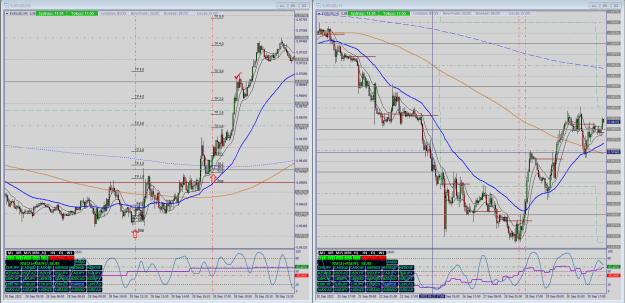
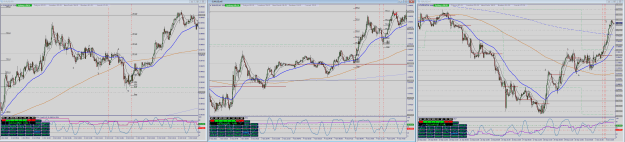
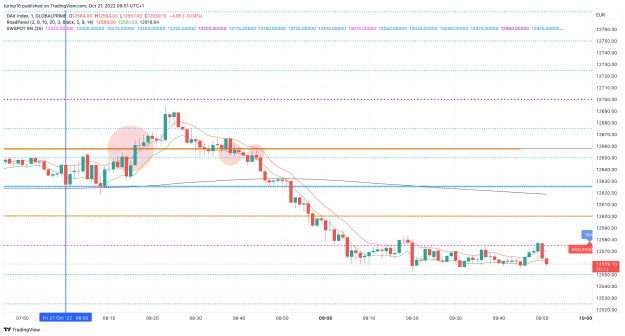
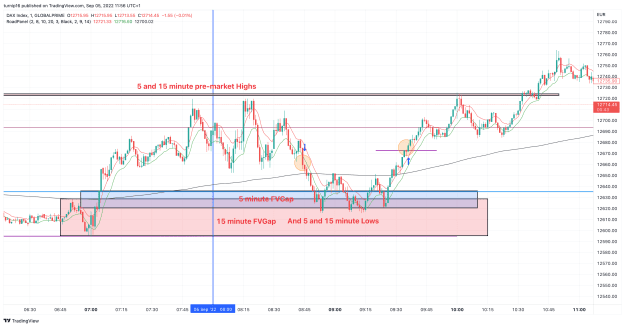
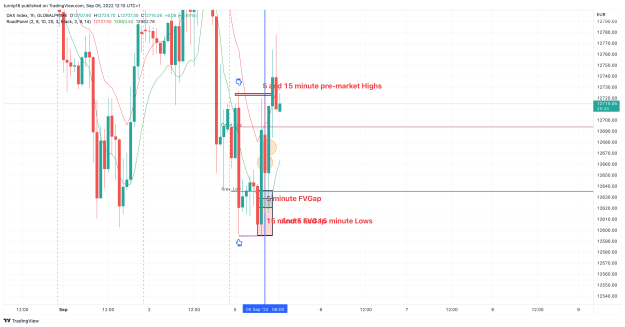
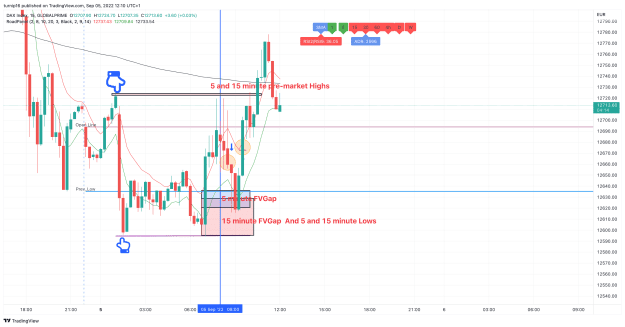
The 15 minute and 5 minute rectangular boxes ( Pink and Blue) show Fair value gaps plus 5 and Fifteen Minutes Highs and Lows. But a later normal "Roadmap" short gets underway at 8:45am (UK time) and a long at 9:35am - both on the 5 minute chart. The one minute charts shows where those 5 minute time frame trades sit on the one minute chart.
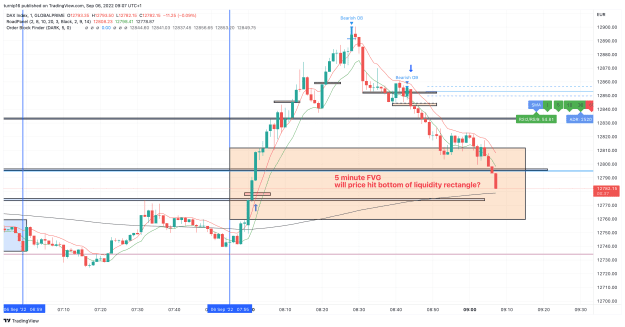
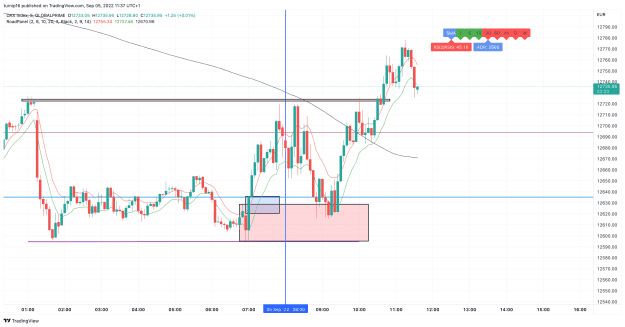
Groping forwards to supplement basic Roadmap but not sure where FVGaps are considered important. I did note that price left FVGaps around 7am near the Big Round Number of 12600 and hit the 5 and 15 minute highs, and returned to the FVgaps around 8:50 - ish. Made an "M" ? type shape, sat on the 200ma then took off upwards. Plus 12650 seemed a notable level all the way to the left.
15 minute and Hourly high/lows seem to match up?
What are your thoughts Chubby ?
Attached Image(s) (click to enlarge)
every Saint has a past. Every Sinner has a Future
2