Hi,
First thing first, I want to say upfront that I'm not here to sell anything. All information shared is, and will always be, free. I also want to thank everyone whose indicators I make use of. There are too many to thank individually so please accept a collective thanks.
I recently decided to stop lurking and join Forex Factory. Trading has provided me with a nice lifestyle over the years and I enjoy giving back. Up until recently I've been privately mentoring a trader but he has progressed to a level where he doesn't require as much input from me. So, I thought I would try to set out how I trade in the hope it might help someone who is struggling or looking for a new approach.
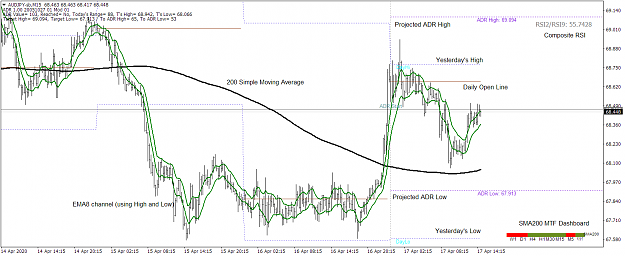
I refer to the whole setup as a roadmap because, rather than flash up buy and sell signals, it provides you with a great deal of information that you can then choose to act upon. Before I get into how I use the roadmap, let's look at a chart marked up with a description of all elements.
Don't worry about recreating this manually. I'll provide all the relevant indicators and a template later. The aim of the roadmap is to provide as much information as possible without the screen becoming cluttered. Each to their own but a screen with 20 indicators just wouldn't work for me. I hope you will find this thread simple to follow.
If anyone finds learning easier on a 'live' basis instead, I've created a Slack group where I will be happy to hang out with you while trading. It's how I mentored my previous student so I'm used to communicating via that platform. I'm usually around during London session but I often also trade the Dow during New York. If you want to join, please send me a private message and I'll provide an invitation. EDIT: Due to high demand I've had to temporarily freeze invitations. Please do contribute to the thread and I will endeavour to ensure regular contributors are added to the Slack group.
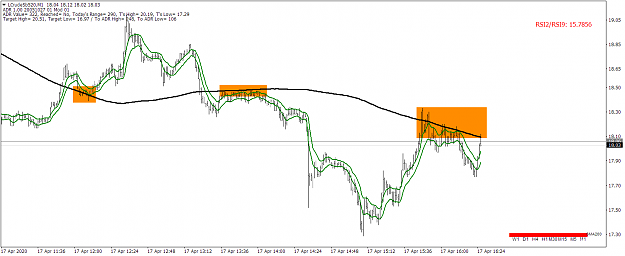
Ok, back to the chart. Let's first look at SMA200. This tells me, based upon where price is in relation to it, a lot about what an instrument has been doing and what it's doing now. I chose SMA200 for two reasons. It's widely used and traded with and it's got a good track record of stopping price, as you can see from this chart.
In addition to the SMA200 being on our chosen timeframe chart, we also can see at a glance whether price is above or below SMA200 thanks to the multi-timeframe dashboard in the bottom right corner. Green means price is above, red means below. I would advise against ignoring this bias, especially the 4 timeframes most relevant to your trading style. If you trade short timeframes, you particularly want to pay attention to the M1-M30. If you are a longer term trader, pay most attention to the H1-W1 timeframes. As a general rule, you want at least 2 of your relevant timeframes to be green for longs or red for shorts.
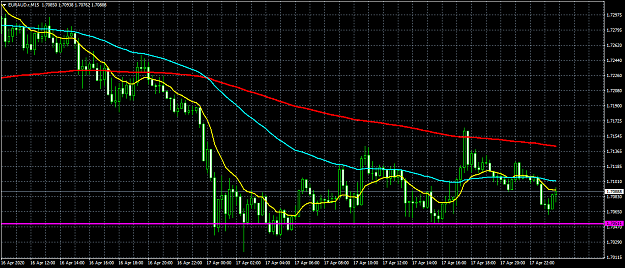
Next we have a channel created by using the High and Low of EMA8. We pay attention to two things with the channel. Where price is in relation to it and where the channel is in relation to SMA200. I originally used Raghee Horner's 34EMA channel but I have altered to 8EMA as it provides much faster confirmation of bias. I will talk a bit about bias during the thread and this provides us with our first one. If the channel is below SMA200 the bias is short and vice versa for long. There is also a slightly more advanced way to use the channel, which is to seek out 'channel failures' where the channel tried but failed to get above/below SMA200. Here's an example of a channel failure.
We also have the previous day's High and Low marked on the chart. These levels will often act as support/resistance so it's worthwhile being aware of them. Here's an example of price being stopped by Previous Day's Low.
The Daily Open Line is also on the chart. I time this to begin at Midnight each day based on my broker's time, which is Central European. This is on the chart because it's quite common for price to seek a route back to the Daily Open Line after it has travelled far from it. The line can also cause price to stop and reverse.
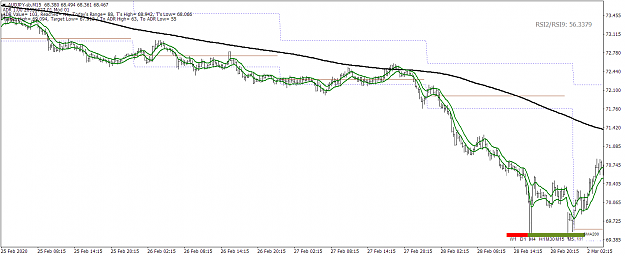
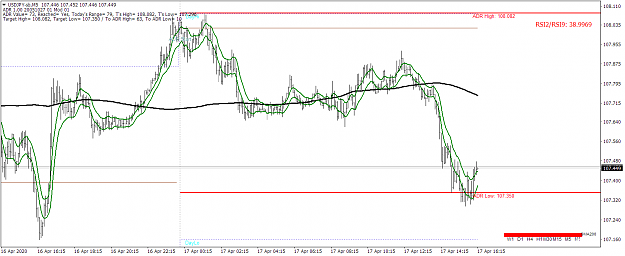
There is also the projected ADR High and Low lines on the chart. These are dynamic and will change throughout the day until they become 'locked'. These are not used for forecasting but they become relevant once locked. This happens when an instrument has completed the Average Daily Range. When this happens, the lines turn a solid red and will not change again that day. A more advanced element of the roadmap is using ADR to find potential reversal points but I will wait a while before getting into that. I'd rather the focus was initially on the trend-following elements of the strategy. Nevertheless, here's a quick picture showing how ADR lines look when locked.
We also have a composite RSI figure on screen. This, together with the MTF Dashboard, provides an at-a-glance idea of the bias. Above 50 is bullish, below 50 is bearish.
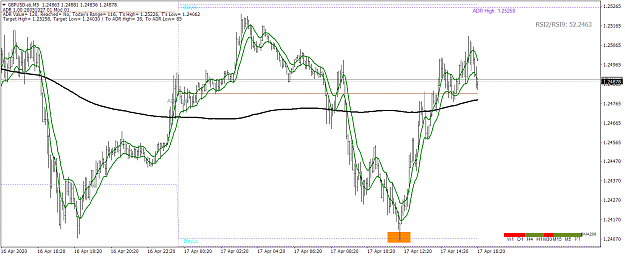
I like to look at all these elements as an information suite. There are different elements that will suit different trading styles. Or, the whole package can be used together. The roadmap is really flexible in terms of instruments and timescales. It can be used from anything between scalping and position trading. Let's look at a few more charts before we go on.
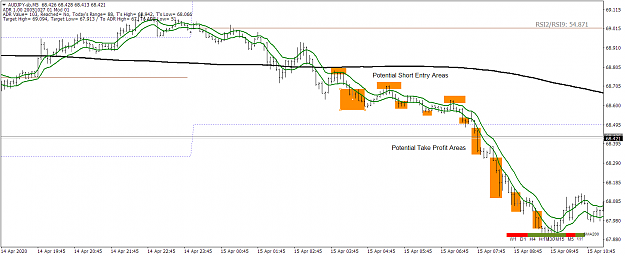
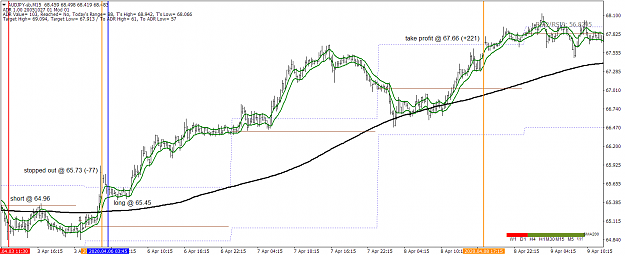
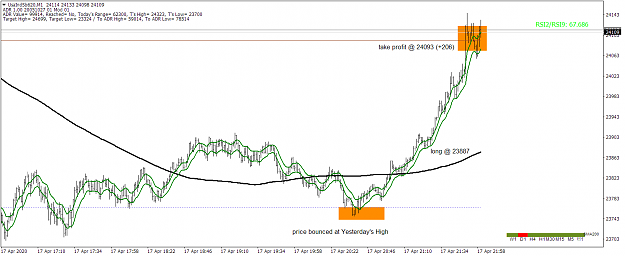
Above you can see an example of potential entry and exit areas simply by using the 8EMA channel for timing. There is also an example of using a stop and reverse strategy and an example of the large moves you can expect to catch from time to time.
I hope this information has provided a useful overview of the roadmap. I trade it every day so I'll be around to post charts, discuss trades and answer any questions.
Thanks for reading.
Laura
(Template and Indicators in next post)
Edit - for those having issues with the RSI tool - attach this to your chart instead - settings are 240,1440,10080,0,500 - that will give you a historical picture of the RSI value but the current value is also visible in the indicator window.
Edit - You can find my journal, which includes summaries of important aspects of trading, here:
https://www.forexfactory.com/showthread.php?t=995014
Edit - Section 5 of my journal demonstrates an EXPERIMENTAL idea for CompRSISelectv2 settings relating to trading 1m indices/oil:
https://www.forexfactory.com/showthr...5#post12910815
Edit - hanover has produced a tool which should make finding roadmap trades easier, you can get it here: https://www.forexfactory.com/showthread.php?t=994835
Edit - freeman03 has produced a template for Tradingview:
https://www.tradingview.com/script/Y...RoadMap-Panel/
Edit - MikeHanson has produced indicators for cTrader:
https://www.forexfactory.com/showthr...8#post12913838
Edit - indalico has produced an indicator which combines TrendStrengthRSI and SMA200 MTF Dashboard:
https://www.forexfactory.com/showthr...5#post12980075
Edit - pedrobhs has created new TradingView scripts:
https://www.forexfactory.com/thread/...0#post13580610
First thing first, I want to say upfront that I'm not here to sell anything. All information shared is, and will always be, free. I also want to thank everyone whose indicators I make use of. There are too many to thank individually so please accept a collective thanks.
I recently decided to stop lurking and join Forex Factory. Trading has provided me with a nice lifestyle over the years and I enjoy giving back. Up until recently I've been privately mentoring a trader but he has progressed to a level where he doesn't require as much input from me. So, I thought I would try to set out how I trade in the hope it might help someone who is struggling or looking for a new approach.
I refer to the whole setup as a roadmap because, rather than flash up buy and sell signals, it provides you with a great deal of information that you can then choose to act upon. Before I get into how I use the roadmap, let's look at a chart marked up with a description of all elements.
Don't worry about recreating this manually. I'll provide all the relevant indicators and a template later. The aim of the roadmap is to provide as much information as possible without the screen becoming cluttered. Each to their own but a screen with 20 indicators just wouldn't work for me. I hope you will find this thread simple to follow.
Ok, back to the chart. Let's first look at SMA200. This tells me, based upon where price is in relation to it, a lot about what an instrument has been doing and what it's doing now. I chose SMA200 for two reasons. It's widely used and traded with and it's got a good track record of stopping price, as you can see from this chart.
In addition to the SMA200 being on our chosen timeframe chart, we also can see at a glance whether price is above or below SMA200 thanks to the multi-timeframe dashboard in the bottom right corner. Green means price is above, red means below. I would advise against ignoring this bias, especially the 4 timeframes most relevant to your trading style. If you trade short timeframes, you particularly want to pay attention to the M1-M30. If you are a longer term trader, pay most attention to the H1-W1 timeframes. As a general rule, you want at least 2 of your relevant timeframes to be green for longs or red for shorts.
Next we have a channel created by using the High and Low of EMA8. We pay attention to two things with the channel. Where price is in relation to it and where the channel is in relation to SMA200. I originally used Raghee Horner's 34EMA channel but I have altered to 8EMA as it provides much faster confirmation of bias. I will talk a bit about bias during the thread and this provides us with our first one. If the channel is below SMA200 the bias is short and vice versa for long. There is also a slightly more advanced way to use the channel, which is to seek out 'channel failures' where the channel tried but failed to get above/below SMA200. Here's an example of a channel failure.
We also have the previous day's High and Low marked on the chart. These levels will often act as support/resistance so it's worthwhile being aware of them. Here's an example of price being stopped by Previous Day's Low.
The Daily Open Line is also on the chart. I time this to begin at Midnight each day based on my broker's time, which is Central European. This is on the chart because it's quite common for price to seek a route back to the Daily Open Line after it has travelled far from it. The line can also cause price to stop and reverse.
There is also the projected ADR High and Low lines on the chart. These are dynamic and will change throughout the day until they become 'locked'. These are not used for forecasting but they become relevant once locked. This happens when an instrument has completed the Average Daily Range. When this happens, the lines turn a solid red and will not change again that day. A more advanced element of the roadmap is using ADR to find potential reversal points but I will wait a while before getting into that. I'd rather the focus was initially on the trend-following elements of the strategy. Nevertheless, here's a quick picture showing how ADR lines look when locked.
We also have a composite RSI figure on screen. This, together with the MTF Dashboard, provides an at-a-glance idea of the bias. Above 50 is bullish, below 50 is bearish.
I like to look at all these elements as an information suite. There are different elements that will suit different trading styles. Or, the whole package can be used together. The roadmap is really flexible in terms of instruments and timescales. It can be used from anything between scalping and position trading. Let's look at a few more charts before we go on.
Above you can see an example of potential entry and exit areas simply by using the 8EMA channel for timing. There is also an example of using a stop and reverse strategy and an example of the large moves you can expect to catch from time to time.
I hope this information has provided a useful overview of the roadmap. I trade it every day so I'll be around to post charts, discuss trades and answer any questions.
Thanks for reading.
Laura
(Template and Indicators in next post)
Edit - for those having issues with the RSI tool - attach this to your chart instead - settings are 240,1440,10080,0,500 - that will give you a historical picture of the RSI value but the current value is also visible in the indicator window.
Attached File(s)
Edit - You can find my journal, which includes summaries of important aspects of trading, here:
https://www.forexfactory.com/showthread.php?t=995014
Edit - Section 5 of my journal demonstrates an EXPERIMENTAL idea for CompRSISelectv2 settings relating to trading 1m indices/oil:
https://www.forexfactory.com/showthr...5#post12910815
Edit - hanover has produced a tool which should make finding roadmap trades easier, you can get it here: https://www.forexfactory.com/showthread.php?t=994835
Edit - freeman03 has produced a template for Tradingview:
https://www.tradingview.com/script/Y...RoadMap-Panel/
Edit - MikeHanson has produced indicators for cTrader:
https://www.forexfactory.com/showthr...8#post12913838
Edit - indalico has produced an indicator which combines TrendStrengthRSI and SMA200 MTF Dashboard:
https://www.forexfactory.com/showthr...5#post12980075
Edit - pedrobhs has created new TradingView scripts:
https://www.forexfactory.com/thread/...0#post13580610
