NOTE: Suggestions for more information are welcome, but will be implemented only if they are deemed to be useful to the community as a whole (as opposed to individual customization; I don't wish to maintain multiple versions of the indicator(s)). I won't post any .mq4 source files without LauraT's express permission, and I won't be writing a MT5 version (I have no experience coding MQL5). I'm not offering a general MT4 programming service. I will 'dislike' posts that are off topic, because they clutter the thread, making it more difficult for readers to follow the flow of information about the indicator(s) posted here.
Terms and Conditions: Please note that if you download and use the indicator(s) here, you agree that you will not sell or distribute them commercially; and that they are supplied 'as is', without any implied guarantees that they are fit for purpose or free of errors, hence you use them at your own risk. I can not accept liability for any computer damage or financial loss.
New features that have been added recently (in version 1.04) are highlighted in yellow. Important notes are highlighted in red typeface.
Version 1.04 is the final version of the Roadmap Dashboard. The indicator appears to be stable and I'm going to have a rest now. Please don't expect replies to your posts. Everything you need to know is available in this post (#1), or can be discovered with a little experimentation.
I have included the version number on the 'About' tab, so that you can check that you're running the latest version, which is currently 1.04 (uploaded July 16, 2020).
[July 29, 2020] Version 1.04 employs two new Wingdings 3 symbols — see the later graphic for the details.
[July 16, 2020] Version 1.03 has a new parameter PlaySoundOnUpdate[highlight=yellow] — if the name of a .wav file (that exists in folder [MT4 installation]/Sounds) is entered, this sound will be played whenever the dashboard is updated. If you don't want a sound, leave this setting blank (empty). Version 1.03 also attempts to fix the issue reported in post #123.
[May 27, 2020] Version 1.02 has a new parameter RSIparameters.
[May 15, 2020] Version 1.01 rearranges the parameter settings into a more logical sequence and also includes section headings.
----------------------------------------------------------------------------------------------
Scanner/dashboard for LauraT's Roadmap approach
----------------------------------------------------------------------------------------------
This is a dashboard (actually it's probably better described as a scanner) indicator for LauraT's RoadMap (see also her journal thread here). It highlights any symbols/timeframes where the near side of the EMA(8) channel comes within ProximityThreshold channel widths of the SMA(200). Hence setting ProximityThreshold to 0 means that the EMA(8) channel must touch or cross the SMA(200). See posts #14 and #46 for more info. The symbol is plotted in BullishColor if the RSI composite >= RSIThreshold; BearishColor if the RSI composite <= (100 – RSIThreshold); and NeutralColor otherwise. It is then left to you to view any relevant chart(s), wait for any suitable setups to materialize, and judge for yourself whether any of these merit an entry.
The CompRSISelectv2 indicator (available here) must be present** in your ...../MQL4/Indicators folder (but doesn't need to be attached to a chart), for the RSI values to be calculated correctly. If all of the Wingdings symbols are red, it's likely that the dashboard can't find the CompRSISelectv2 indicator, i.e. the RSI calculation is 0 (which is less than the lower threshold of 40). The values passed to the indicator using iCustom() are Tframe1=240, Tframe2=1440, Tframe3=10080, Tframe4=0, NumBars=500.
**[New: v1.02]: you can now specify the indicator you wish to have calculate the RSI values, followed by the five values you wish to use for Tframe1, Tframe2, Tframe3, Tframe4 and NumBars, all separated by commas, in the new parameter setting RSIparameters. The default values are CompRSISelectv2,240,1440,10080,0,500
The .ex4 file for your named RSI indicator must exist in the folder .../MQL4/Indicators
The indicator uses symbols from both the Wingdings and Wingdings 3 fonts (there's a video on how to intstall fonts for Windows 10 here). These fonts should come with Windows. However, if the fonts are missing, you will likely get the problem reported in post #35.
The following shorthand can be used for Symbols: A=AUD, C=CAD, E=EUR, F=CHF, G=GBP, J=JPY, N=NZD, U=USD. Capitals or lowercase work interchangeably, e.g. GJ or gj for GBPJPY. This works for the 28 majors; otherwise, you must type the symbol name in full. To save you some typing, SymbolSuffix will be appended to every symbol. Any misspelled symbols, or symbols not offered by your broker, are ignored. Up to 99 valid symbol IDs may be entered, separated by commas.
NOTE: If you want the symbol to be processed 'as is' (including capitalization and punctuation), precede it with an equal sign (=). For example =DJ30.fs (SymbolSuffix will not be appended).
WingdingsSymbol table here.
The PositionSettings from left to right are:
Chart Sub-window# (0=main chart, 1=first subwindow, 2=second subwindow, etc)
Corner (TR=Top Right, TL=Top Left, BR=Bottom Right, BL=Bottom Left. The order of the timeframes is reversed horizontally if 'Right' is chosen, and the order of the symbols is reversed vertically if 'Bottom' is chosen)
Horizontal (x) start position
Horizontal adjustment (distance between symbol name and first timeframe)
Horizontal spacing (distance between timeframe columns)
Vertical (y) start position
Vertical spacing (distance between symbols)
Entries must be separated by commas. All measurements are in pixels.
To omit the background, set BackgroundWidth to 0. The width is in characters (the Webdings character 'g' is plotted BackgroundWidth times to generate the background), not pixels.
Valid RefreshPeriod entries are explained here.
PrintRSIvalues —
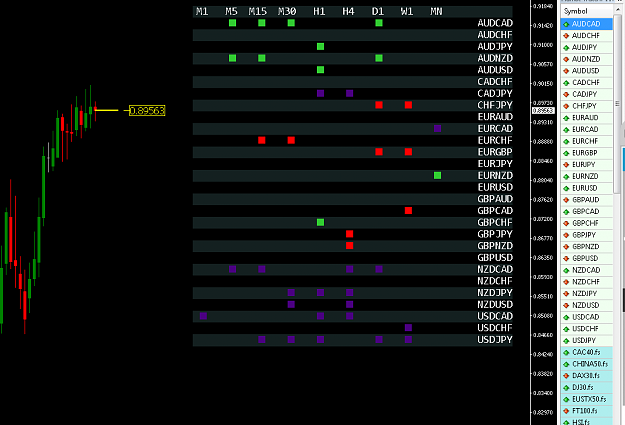
If set to 0, the indicator plots WingdingsSymbol in the cells (intersection of symbol/timeframe) where the EMA(8) channel is within ProximityThreshold channel widths of the SMA(200). This is plotted in the BullishColor if the RSI composite value >= RSIThreshold, the BearishColor if the RSI composite value <= (100 – RSIThreshold), and in NeutralColor otherwise. See post #14. It also disables the PrintHeatmap facility.
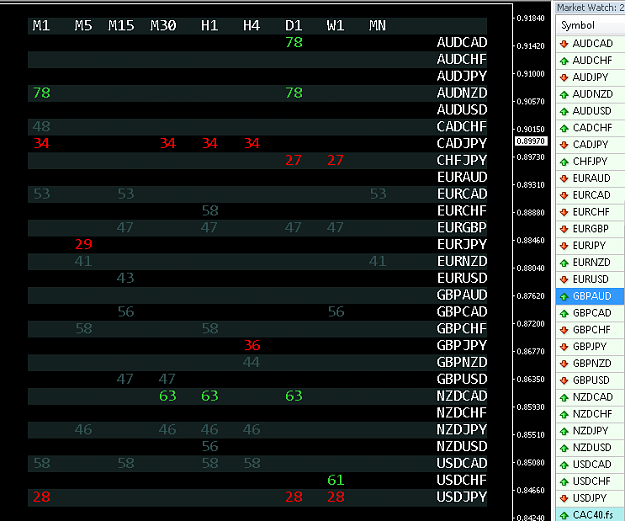
If set to 1, the indicator plots the RSI value instead of the WingdingsSymbol, using the same rules for proximity and colors, and the PrintHeatmap function is enabled. Note that the printed RSI values are necessarily the same across every timeframe, because they are always calculated as a composite of the H4/D1/W1 timeframes.
If set to 2, the RSI value will be printed in the monthly (MN) column, but only if you have MN selected as one of your TimeFrames. This option allows you to see the RSI values for each instrument regardless of whether proximity to the SMA exists or not. If proximity to the SMA exists on the monthly timeframe, then the RSI value is printed in the MN column as normal, e.g. 53 If proximity doesn't exist, then the value printed inside square brackets, e.g. [53]
PrintHeatmap — these are the timeframes in which you want cja's heatmap values to plot as a small circle (Wingdings chracter 159) next to the RSI value. As with cja's indicator, the circle is plotted in BullishColor if price is currently above the SMA(200) for that timeframe; and BearishColor if the price is below it. If you don't want any circles to plot, either make this setting blank (empty), or set PrintRSIvalues to 0.
ATRdays — if set to a value > 0, this will plot an upward pointing triangle in BullishColor next to the symbol ID if price comes within ProximityThreshold channel widths of the ADR low, and a downward pointing triangle in BearishColor if price comes within ProximityThreshold channel widths of the ADR high. To disable this feature, set ATRdays to 0. (I'm pretty sure I've figured out the calculation behind the plotting of the ADR high and low lines, but please let me know if you think there's an error).
If price comes within ProximityThreshold channel widths of yesterday's high or low, a twin arrows symbol is printed (BearishColor for yesterday's high, BullishColor for yesterday's low), since this can potentially act as either support or resistance.
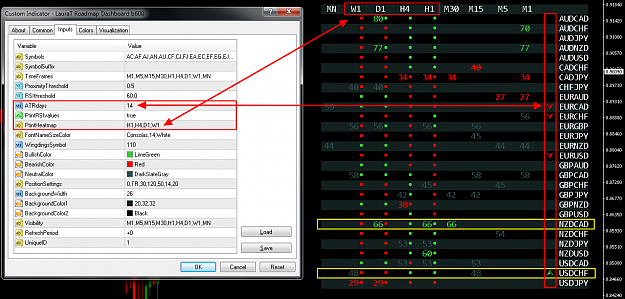
To explain this further with examples, look at the NZDCAD and USDCHF (that are highlighted inside yellow boxes in the final screenshot):
For the NZDCAD, the EMA(8) channel gets within ProximityThreshold channel widths of the SMA(200) on the D1, H1 and M30 timeframes, which is why the RSI value of 66 prints in those columns. It plots in BullishColor (green) because the RSI >= 60. it is And the cja heatmap is bearish in the W1 and D1 timeframes (price < SMA200), and bullish in the H4 and H1 (price >= SMA200).
For the USDCHF, the EMA(8) channel gets within ProximityThreshold channel widths of the SMA(200) on the W1 and M15 timeframes, which is why the RSI value of 48 prints in those columns. It plots in the NeutralColor because 48 is neither >= 60, nor <= 40. The cja heatmap is bearish in the W1 and D1 timeframes (price < SMA200), and bullish in the H4 and H1. Additionally, the price is currently within ProximityThreshold channel widths of the ADR low, hence a BullishColor up-arrow is printed alongside the symbol ID.
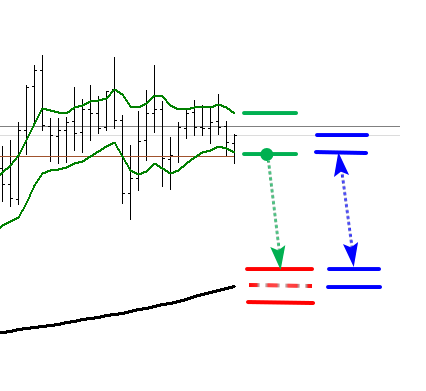
Explanation of the symbols
('proximity' = the width of the EMA(8) channel x the ProximityThreshold)
Note that the first three symbols in the image are replaced by numbers (the RSI value) if PrintRSIvalues is set to 1 or 2
The grahic assumes that you are using the default settings (some of the colors and symbols may be changed) 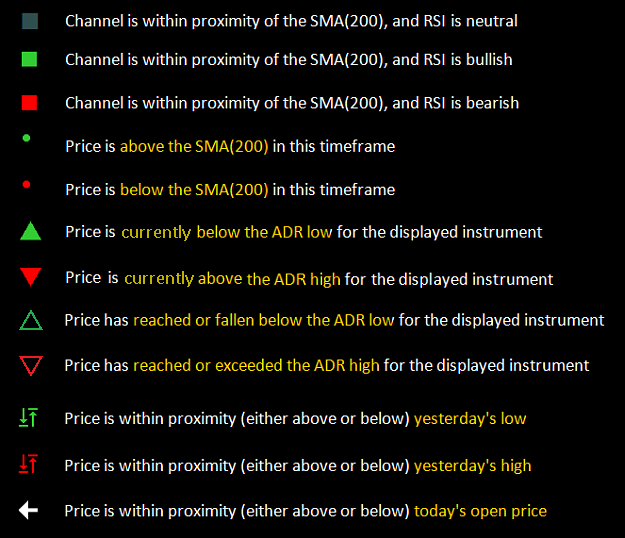
Note (v 1.04): the FILLED triangles denote that price is CURRENTLY below the ADR low, or above the ADR high.
The EMPTY triangles denote that price has PREVIOUSLY reached the ADR low/high, but is currently inside the range between these levels.
In both cases, the ADR lines should be MAGENTA and LOCKED on the price chart.
However, I haven't been able to exactly replicate the calculation used in the '!SM_ADR Marker' indicator, hence there may be minor discrepancies.
You can set different RSI thresholds for different instruments that override both RSIthreshold and AlertRSIthreshold values, by typing your desired override value inside curly braces immediately after the relevant symbolID in Symbols, e.g. ...... ,EU{55}, ...... would cause the RSI values to print in BullishColor if the RSI composite for EURUSD >= 55 or BearishColor if <= 45. And alerts would be generated only if the RSI composite for EURUSD is >= 55 or <= 45 also. Any instrument that doesn't have an override simply uses the RSIthreshold and AlertRSIthreshold values.
The dashboard can be as simple or complex as you wish — see post #102. If you find the use of any of the settings confusing, simply disable them. The more complex functions exist for traders who want to view the additional detail without having to load the actual price chart.
If you want to use multiple instances of the indicator (even if they are on different charts), you must use a different UniqueID for each instance, otherwise the indicator will get horribly confused, causing unpredictable results.
Warning: There are several heavy calculations involved, hence the more symbols/timeframes you specify, the slower your MT4 will likely run, especially if the RefreshPeriod parameter is set to a short period, e.g. T or M1. Also I suggest that, to avoid clutter, you attach the indicator to its own dedicated chart. As anybody who follows my work will know, I prioritize functionality and accuracy over user-friendliness and cosmetic appeal.
Alerts are available, see the 'Alerts' section below.
Please feel welcome to experiment with the settings. If you think you've found a bug, please include (1) a comprehensive description of the problem, (2) the conditions that caused it to occur, and (3) a screenshot showing both your settings and a chart showing where you believe any measurement is inaccurate, as an absolute minimum. Otherwise I have nothing to work with.
_____________________
New facility (April 30, 2020):
Alerts
The latest version of the dashboard includes alerts. There are 'basic' and 'complex' alert settings, both of which are explained below.
Basic settings
There are 3 types of alerts available: popup (audible on-screen) alerts, email alerts, and push notifications.
If you don't want alerts of any of these types, set MinutesBetweenAlerts to -1 (and the dashboard will work exactly as it did before).
If you want alerts, set MinutesBetweenAlerts to 0, and then:
If you want popup alerts, set MessageForPopupAlerts to the basic message that you want to appear. If you don't want these, set MessageForPopupAlerts to blank (empty).
If you want email alerts, set MessageForEmailAlerts to the basic message that you want to appear in the subject line of the email. If you don't want these, set MessageForEmailAlerts to blank (empty).
If you want push notification alerts, set MessageForPushAlerts to the basic message that you want to appear. If you don't want these, set MessageForPushAlerts to blank (empty).
Leave the AlertTimeframes set to '' (two single quotes, i.e. ditto). This will mean that the you will (potentially) get alerts for the same timeframes that are displayed on the dashboard (your entry in TimeFrames).
Leave AlertRSIThreshold set to 60, and you'll get 'SMA' type alerts only when the proximity requirement is met AND the RSI value is either >= 60 or <= 40. If you want instruments/timeframes where the proximity requirement is met to be included in alerts regardless of the RSI value, set AlertRSIThreshold to -1.
To improve efficiency, the instruments/timeframes/reasons-for-alert are all gathered up and displayed as a single alert. These alerts will occur once every RefreshPeriod (unless NONE of the instruments/timeframes/reasons-for-alert meet the criteria that's required for them to be highlighted in the dashboard display). This means that if the required criteria repeats itself across successive RefreshPeriods, for a given instrument/timeframe/reason-for-alert, then the same alert will be included every RefreshPeriod. This shortcoming can be avoided by using the complex alerts settings (see below).
The alert text for each instrument/timeframe/reason-for-alert appears in the form:
[instrument,timeframe,reason-for-alert,RSI-value]
AlertReasons — The 6 possible reasons for alerts being generated are as follows:
SMA — the EMA(8) is within the proximity (ProximityThreshold channel widths) of the SMA(200) for the displayed instrument/timeframe
ADR_high — price has reached or exceeded the ADR high for the displayed instrument
ADR_low — price has reached or fallen below the ADR low for the displayed instrument
Yest_high — price is within proximity (either above or below) yesterday's high
Yest_low — price is within proximity (either above or below) yesterday's low
Day_open — price is within proximity (either above or below) today's open price
You can choose the reasons for which you want alerts to be generated. The parameter AlertReasons begins with all 6 possible reasons by default. You can disable some of these reasons by removing the appropriate text from AlertReasons. If you want to re-enable a reason, any mixture of upper or lowercase is ok, but you must get the spelling correct (as shown in the list above), including the underscore character, e.g. adr_high
You can include spaces, commas or any other characters to improve readability; the indicator is simply looking to find text like ADR_high anywhere within the parameter.
Only items that are being highlighted in the dashboard (this depends on your chosen settings) will be alerted. The more instruments, timeframes and/or reasons that you have selected on in the dashboard, the more likely it is that (for better or worse) you'll get some kind of alert every RefreshPeriod.
Please read the above carefully and experiment for yourself, because (sorry) I don't have a lot of time to answer questions. If you're confused and want a simpler dashboard, you might want to check out Barraka's creation (here).
The complex alert settings are AlertTimeframes and MinutesBetweenAlerts.
AlertTimeframes — as already explained, typing two single quotes ('') into AlertTimeframes causes the TimeFrames that you are displaying in the dashboard to also be those that are scanned for alerts. However, you can use a subset of these for alerts by inputting those timeframes here. For example, if your TimeFrames displayed on the dashboard are M5,M15,M30,H1 but you want to be alerted for proximities only on the M5 and M15, then set AlertTimeframes = M5,M15
MinutesBetweenAlerts — valid values are:
-1 : turn all alerts off
0 : turn alerts on, and check items (instruments/timeframes/reasons-for-alerts) for possible alerts on the first tick of every RefreshPeriod candle. For example, if RefreshPeriod = M1, then the indicator will check for possible proximities etc, and potentially generate alerts of all of the types (popup, email, push notications) you've selected, on the first tick of every M1 candle (regardless of the chart timeframe). Which types of alerts are generated is determined by your entries in MessageForPopupAlerts, MessageForEmailAlerts, MessageForPushAlerts (as expained previously).
any value > 0 : the dashboard will still be updated, and possible alerts checked for, every ResfreshPeriod, but if an alert for a given item (instrument/timeframe/reason-for-alert) has occurred within the last MinutesBeweenAlerts minutes, it will not be repeated until a further MinutesBeweenAlerts minutes have elapsed. For example, suppose a (proximity) alert for USDCHF,M1,SMA first occurs at 12:15, and MinutesBetweenAlerts = 10, then although alerts will continue to be checked every 1 minute, another alert for USDCHF,M1,SMA will not be generated until at least 10 minutes after 12:15, i.e. 12:25. Note how these alerts operate separately for each individual item, e.g. if an alert for USDCHF,M5,SMA is generated at 12:16, then the next alert for USDCHF,M5,SMA can't be generated until 12:26.
To summarize, the MinutesBetweenAlerts facility allows alerts to be generated for any new item (instrument/timeframe/reason-for-alert) that meets the necessary criteria every RefreshPeriod, but prevents alerts for the same item from being generated repeatedly (assuming that the reason, e.g. proximity, is still being met), by suspending any repetition for an additional MinutesBetweenAlerts minutes. Obviously if a reason's requirement is no longer being met, then the alert will not be generated, also.
Technical info: the MinutesBetweenAlerts facility works by storing the date/time that each given item (instrument/timeframe/reason-for-alert) in a MT4 Global Variable. The current time is then compared to the stored time to determine whether the required number of minutes have elapsed since an alert for that item was generated. The values stored in Global Variables remain intact if a chart is refreshed, if the indicator is deattached and then reattached to a chart, or even if MT4 is stopped and restarted. The name of each Global Variable is
@LauraT_UniqueID_[symbolID,timeframe,reason-for-alert]
You can reset the alerts by clicking the 'Reset Alerts' button. This deletes all of the required Global Variables, effectively resetting the alerts (i.e. the starting time for MinutesBetweenAlerts is reset to 0). The comment message '== Alerts have been reset ==' will appear in the top left corner of the main price chart until the next price tick occurs.
Keep in mind that the purpose of alerts is merely to alert you to a possible condition as soon as it occurs. It is then left to you to view any relevant chart(s), wait for any suitable setups to materialize, and judge for yourself whether any of these merit an entry.
Troubleshooting tips
I can't check historical situations that have been and gone, and moreover, I don't have data from your broker, or info about your computer.
1. If alerts aren't reaching your email or phone:
(i) type Ctrl-O in MT4 to get the 'Options' panel and check that you have the correct settings in the Email and Notifications tabs. Contact your ISP or telecomms provider for help. I live in New Zealand and I have no knowledge of how telecomms operate in your country.
(ii) turn popup alerts on (set MinutesBetweenAlerts to 0, and type the message you want to get in MessageForPopupAlerts). If the alert is occurring correctly as a popup, but not as an email or push notification, then any fault is not with the indicator, because it handles all 3 alert types together and in exactly the same manner.
2. If you think an item (instrument/timeframe/reason) is missing from the alerts, or conversely, one is being alerted that shouldn't be, check the dashboard to see whether it's present there. Only items that are being highlighted in the dashboard can be alerted. And of course double check your alert settings in the dashboard indicator, after reading the instructions above carefully.
3. If you think an item is not being reported on the dashboard itself, or conversely, is being displayed on the dashboard when it shouldn't be, check the actual chart itself, with Laura's template applied.
If you want me to take a look with any of these, you'll need to provide screenshots of (i) your parameter settings for the dashboard indicator, (ii) the dashboard itself, and (iii) the chart with Laura's template. (And if the problem is alerts related, (iv) your popup alerts window). Obviously I don't have x-ray vision to see your computer from where I live. And I don't have the time, or want to invade your computer's privacy, by using some kind of remote viewing tool (like Team Viewer).
Installation files
Download the LauraT Roadmap Dashboard b600.ex4 indicator into your ...../MQL4/Indicators folder
Download the CompRSISelectv2.mq4 indicator into your ...../MQL4/Indicators folder
Then load MT4's Navigator (type Ctrl-N), and then right-click, and click Refresh.
The above files should now show under the 'Indicators' tree.
NOTE: The indicator uses symbols from both the Wingdings and Wingdings 3 fonts (there's a video on how to intstall fonts for Windows 10 here).
Terms and Conditions: Please note that if you download and use the indicator(s) here, you agree that you will not sell or distribute them commercially; and that they are supplied 'as is', without any implied guarantees that they are fit for purpose or free of errors, hence you use them at your own risk. I can not accept liability for any computer damage or financial loss.
New features that have been added recently (in version 1.04) are highlighted in yellow. Important notes are highlighted in red typeface.
Version 1.04 is the final version of the Roadmap Dashboard. The indicator appears to be stable and I'm going to have a rest now. Please don't expect replies to your posts. Everything you need to know is available in this post (#1), or can be discovered with a little experimentation.
I have included the version number on the 'About' tab, so that you can check that you're running the latest version, which is currently 1.04 (uploaded July 16, 2020).
[July 29, 2020] Version 1.04 employs two new Wingdings 3 symbols — see the later graphic for the details.
[July 16, 2020] Version 1.03 has a new parameter PlaySoundOnUpdate[highlight=yellow] — if the name of a .wav file (that exists in folder [MT4 installation]/Sounds) is entered, this sound will be played whenever the dashboard is updated. If you don't want a sound, leave this setting blank (empty). Version 1.03 also attempts to fix the issue reported in post #123.
[May 27, 2020] Version 1.02 has a new parameter RSIparameters.
[May 15, 2020] Version 1.01 rearranges the parameter settings into a more logical sequence and also includes section headings.
----------------------------------------------------------------------------------------------
Scanner/dashboard for LauraT's Roadmap approach
----------------------------------------------------------------------------------------------
This is a dashboard (actually it's probably better described as a scanner) indicator for LauraT's RoadMap (see also her journal thread here). It highlights any symbols/timeframes where the near side of the EMA(8) channel comes within ProximityThreshold channel widths of the SMA(200). Hence setting ProximityThreshold to 0 means that the EMA(8) channel must touch or cross the SMA(200). See posts #14 and #46 for more info. The symbol is plotted in BullishColor if the RSI composite >= RSIThreshold; BearishColor if the RSI composite <= (100 – RSIThreshold); and NeutralColor otherwise. It is then left to you to view any relevant chart(s), wait for any suitable setups to materialize, and judge for yourself whether any of these merit an entry.
The CompRSISelectv2 indicator (available here) must be present** in your ...../MQL4/Indicators folder (but doesn't need to be attached to a chart), for the RSI values to be calculated correctly. If all of the Wingdings symbols are red, it's likely that the dashboard can't find the CompRSISelectv2 indicator, i.e. the RSI calculation is 0 (which is less than the lower threshold of 40). The values passed to the indicator using iCustom() are Tframe1=240, Tframe2=1440, Tframe3=10080, Tframe4=0, NumBars=500.
**[New: v1.02]: you can now specify the indicator you wish to have calculate the RSI values, followed by the five values you wish to use for Tframe1, Tframe2, Tframe3, Tframe4 and NumBars, all separated by commas, in the new parameter setting RSIparameters. The default values are CompRSISelectv2,240,1440,10080,0,500
The .ex4 file for your named RSI indicator must exist in the folder .../MQL4/Indicators
The indicator uses symbols from both the Wingdings and Wingdings 3 fonts (there's a video on how to intstall fonts for Windows 10 here). These fonts should come with Windows. However, if the fonts are missing, you will likely get the problem reported in post #35.
The following shorthand can be used for Symbols: A=AUD, C=CAD, E=EUR, F=CHF, G=GBP, J=JPY, N=NZD, U=USD. Capitals or lowercase work interchangeably, e.g. GJ or gj for GBPJPY. This works for the 28 majors; otherwise, you must type the symbol name in full. To save you some typing, SymbolSuffix will be appended to every symbol. Any misspelled symbols, or symbols not offered by your broker, are ignored. Up to 99 valid symbol IDs may be entered, separated by commas.
NOTE: If you want the symbol to be processed 'as is' (including capitalization and punctuation), precede it with an equal sign (=). For example =DJ30.fs (SymbolSuffix will not be appended).
WingdingsSymbol table here.
The PositionSettings from left to right are:
Chart Sub-window# (0=main chart, 1=first subwindow, 2=second subwindow, etc)
Corner (TR=Top Right, TL=Top Left, BR=Bottom Right, BL=Bottom Left. The order of the timeframes is reversed horizontally if 'Right' is chosen, and the order of the symbols is reversed vertically if 'Bottom' is chosen)
Horizontal (x) start position
Horizontal adjustment (distance between symbol name and first timeframe)
Horizontal spacing (distance between timeframe columns)
Vertical (y) start position
Vertical spacing (distance between symbols)
Entries must be separated by commas. All measurements are in pixels.
To omit the background, set BackgroundWidth to 0. The width is in characters (the Webdings character 'g' is plotted BackgroundWidth times to generate the background), not pixels.
Valid RefreshPeriod entries are explained here.
PrintRSIvalues —
If set to 0, the indicator plots WingdingsSymbol in the cells (intersection of symbol/timeframe) where the EMA(8) channel is within ProximityThreshold channel widths of the SMA(200). This is plotted in the BullishColor if the RSI composite value >= RSIThreshold, the BearishColor if the RSI composite value <= (100 – RSIThreshold), and in NeutralColor otherwise. See post #14. It also disables the PrintHeatmap facility.
If set to 1, the indicator plots the RSI value instead of the WingdingsSymbol, using the same rules for proximity and colors, and the PrintHeatmap function is enabled. Note that the printed RSI values are necessarily the same across every timeframe, because they are always calculated as a composite of the H4/D1/W1 timeframes.
If set to 2, the RSI value will be printed in the monthly (MN) column, but only if you have MN selected as one of your TimeFrames. This option allows you to see the RSI values for each instrument regardless of whether proximity to the SMA exists or not. If proximity to the SMA exists on the monthly timeframe, then the RSI value is printed in the MN column as normal, e.g. 53 If proximity doesn't exist, then the value printed inside square brackets, e.g. [53]
PrintHeatmap — these are the timeframes in which you want cja's heatmap values to plot as a small circle (Wingdings chracter 159) next to the RSI value. As with cja's indicator, the circle is plotted in BullishColor if price is currently above the SMA(200) for that timeframe; and BearishColor if the price is below it. If you don't want any circles to plot, either make this setting blank (empty), or set PrintRSIvalues to 0.
ATRdays — if set to a value > 0, this will plot an upward pointing triangle in BullishColor next to the symbol ID if price comes within ProximityThreshold channel widths of the ADR low, and a downward pointing triangle in BearishColor if price comes within ProximityThreshold channel widths of the ADR high. To disable this feature, set ATRdays to 0. (I'm pretty sure I've figured out the calculation behind the plotting of the ADR high and low lines, but please let me know if you think there's an error).
If price comes within ProximityThreshold channel widths of yesterday's high or low, a twin arrows symbol is printed (BearishColor for yesterday's high, BullishColor for yesterday's low), since this can potentially act as either support or resistance.
To explain this further with examples, look at the NZDCAD and USDCHF (that are highlighted inside yellow boxes in the final screenshot):
For the NZDCAD, the EMA(8) channel gets within ProximityThreshold channel widths of the SMA(200) on the D1, H1 and M30 timeframes, which is why the RSI value of 66 prints in those columns. It plots in BullishColor (green) because the RSI >= 60. it is And the cja heatmap is bearish in the W1 and D1 timeframes (price < SMA200), and bullish in the H4 and H1 (price >= SMA200).
For the USDCHF, the EMA(8) channel gets within ProximityThreshold channel widths of the SMA(200) on the W1 and M15 timeframes, which is why the RSI value of 48 prints in those columns. It plots in the NeutralColor because 48 is neither >= 60, nor <= 40. The cja heatmap is bearish in the W1 and D1 timeframes (price < SMA200), and bullish in the H4 and H1. Additionally, the price is currently within ProximityThreshold channel widths of the ADR low, hence a BullishColor up-arrow is printed alongside the symbol ID.
Explanation of the symbols
('proximity' = the width of the EMA(8) channel x the ProximityThreshold)
Note that the first three symbols in the image are replaced by numbers (the RSI value) if PrintRSIvalues is set to 1 or 2
The grahic assumes that you are using the default settings (some of the colors and symbols may be changed)
Attached Image
Note (v 1.04): the FILLED triangles denote that price is CURRENTLY below the ADR low, or above the ADR high.
The EMPTY triangles denote that price has PREVIOUSLY reached the ADR low/high, but is currently inside the range between these levels.
In both cases, the ADR lines should be MAGENTA and LOCKED on the price chart.
However, I haven't been able to exactly replicate the calculation used in the '!SM_ADR Marker' indicator, hence there may be minor discrepancies.
You can set different RSI thresholds for different instruments that override both RSIthreshold and AlertRSIthreshold values, by typing your desired override value inside curly braces immediately after the relevant symbolID in Symbols, e.g. ...... ,EU{55}, ...... would cause the RSI values to print in BullishColor if the RSI composite for EURUSD >= 55 or BearishColor if <= 45. And alerts would be generated only if the RSI composite for EURUSD is >= 55 or <= 45 also. Any instrument that doesn't have an override simply uses the RSIthreshold and AlertRSIthreshold values.
The dashboard can be as simple or complex as you wish — see post #102. If you find the use of any of the settings confusing, simply disable them. The more complex functions exist for traders who want to view the additional detail without having to load the actual price chart.
If you want to use multiple instances of the indicator (even if they are on different charts), you must use a different UniqueID for each instance, otherwise the indicator will get horribly confused, causing unpredictable results.
Warning: There are several heavy calculations involved, hence the more symbols/timeframes you specify, the slower your MT4 will likely run, especially if the RefreshPeriod parameter is set to a short period, e.g. T or M1. Also I suggest that, to avoid clutter, you attach the indicator to its own dedicated chart. As anybody who follows my work will know, I prioritize functionality and accuracy over user-friendliness and cosmetic appeal.
Alerts are available, see the 'Alerts' section below.
Please feel welcome to experiment with the settings. If you think you've found a bug, please include (1) a comprehensive description of the problem, (2) the conditions that caused it to occur, and (3) a screenshot showing both your settings and a chart showing where you believe any measurement is inaccurate, as an absolute minimum. Otherwise I have nothing to work with.
Attached Image (click to enlarge)
Attached Image (click to enlarge)
Attached Image (click to enlarge)
_____________________
New facility (April 30, 2020):
Alerts
The latest version of the dashboard includes alerts. There are 'basic' and 'complex' alert settings, both of which are explained below.
Basic settings
There are 3 types of alerts available: popup (audible on-screen) alerts, email alerts, and push notifications.
If you don't want alerts of any of these types, set MinutesBetweenAlerts to -1 (and the dashboard will work exactly as it did before).
If you want alerts, set MinutesBetweenAlerts to 0, and then:
If you want popup alerts, set MessageForPopupAlerts to the basic message that you want to appear. If you don't want these, set MessageForPopupAlerts to blank (empty).
If you want email alerts, set MessageForEmailAlerts to the basic message that you want to appear in the subject line of the email. If you don't want these, set MessageForEmailAlerts to blank (empty).
If you want push notification alerts, set MessageForPushAlerts to the basic message that you want to appear. If you don't want these, set MessageForPushAlerts to blank (empty).
Leave the AlertTimeframes set to '' (two single quotes, i.e. ditto). This will mean that the you will (potentially) get alerts for the same timeframes that are displayed on the dashboard (your entry in TimeFrames).
Leave AlertRSIThreshold set to 60, and you'll get 'SMA' type alerts only when the proximity requirement is met AND the RSI value is either >= 60 or <= 40. If you want instruments/timeframes where the proximity requirement is met to be included in alerts regardless of the RSI value, set AlertRSIThreshold to -1.
To improve efficiency, the instruments/timeframes/reasons-for-alert are all gathered up and displayed as a single alert. These alerts will occur once every RefreshPeriod (unless NONE of the instruments/timeframes/reasons-for-alert meet the criteria that's required for them to be highlighted in the dashboard display). This means that if the required criteria repeats itself across successive RefreshPeriods, for a given instrument/timeframe/reason-for-alert, then the same alert will be included every RefreshPeriod. This shortcoming can be avoided by using the complex alerts settings (see below).
The alert text for each instrument/timeframe/reason-for-alert appears in the form:
[instrument,timeframe,reason-for-alert,RSI-value]
AlertReasons — The 6 possible reasons for alerts being generated are as follows:
SMA — the EMA(8) is within the proximity (ProximityThreshold channel widths) of the SMA(200) for the displayed instrument/timeframe
ADR_high — price has reached or exceeded the ADR high for the displayed instrument
ADR_low — price has reached or fallen below the ADR low for the displayed instrument
Yest_high — price is within proximity (either above or below) yesterday's high
Yest_low — price is within proximity (either above or below) yesterday's low
Day_open — price is within proximity (either above or below) today's open price
You can choose the reasons for which you want alerts to be generated. The parameter AlertReasons begins with all 6 possible reasons by default. You can disable some of these reasons by removing the appropriate text from AlertReasons. If you want to re-enable a reason, any mixture of upper or lowercase is ok, but you must get the spelling correct (as shown in the list above), including the underscore character, e.g. adr_high
You can include spaces, commas or any other characters to improve readability; the indicator is simply looking to find text like ADR_high anywhere within the parameter.
Only items that are being highlighted in the dashboard (this depends on your chosen settings) will be alerted. The more instruments, timeframes and/or reasons that you have selected on in the dashboard, the more likely it is that (for better or worse) you'll get some kind of alert every RefreshPeriod.
Please read the above carefully and experiment for yourself, because (sorry) I don't have a lot of time to answer questions. If you're confused and want a simpler dashboard, you might want to check out Barraka's creation (here).
The complex alert settings are AlertTimeframes and MinutesBetweenAlerts.
AlertTimeframes — as already explained, typing two single quotes ('') into AlertTimeframes causes the TimeFrames that you are displaying in the dashboard to also be those that are scanned for alerts. However, you can use a subset of these for alerts by inputting those timeframes here. For example, if your TimeFrames displayed on the dashboard are M5,M15,M30,H1 but you want to be alerted for proximities only on the M5 and M15, then set AlertTimeframes = M5,M15
MinutesBetweenAlerts — valid values are:
-1 : turn all alerts off
0 : turn alerts on, and check items (instruments/timeframes/reasons-for-alerts) for possible alerts on the first tick of every RefreshPeriod candle. For example, if RefreshPeriod = M1, then the indicator will check for possible proximities etc, and potentially generate alerts of all of the types (popup, email, push notications) you've selected, on the first tick of every M1 candle (regardless of the chart timeframe). Which types of alerts are generated is determined by your entries in MessageForPopupAlerts, MessageForEmailAlerts, MessageForPushAlerts (as expained previously).
any value > 0 : the dashboard will still be updated, and possible alerts checked for, every ResfreshPeriod, but if an alert for a given item (instrument/timeframe/reason-for-alert) has occurred within the last MinutesBeweenAlerts minutes, it will not be repeated until a further MinutesBeweenAlerts minutes have elapsed. For example, suppose a (proximity) alert for USDCHF,M1,SMA first occurs at 12:15, and MinutesBetweenAlerts = 10, then although alerts will continue to be checked every 1 minute, another alert for USDCHF,M1,SMA will not be generated until at least 10 minutes after 12:15, i.e. 12:25. Note how these alerts operate separately for each individual item, e.g. if an alert for USDCHF,M5,SMA is generated at 12:16, then the next alert for USDCHF,M5,SMA can't be generated until 12:26.
To summarize, the MinutesBetweenAlerts facility allows alerts to be generated for any new item (instrument/timeframe/reason-for-alert) that meets the necessary criteria every RefreshPeriod, but prevents alerts for the same item from being generated repeatedly (assuming that the reason, e.g. proximity, is still being met), by suspending any repetition for an additional MinutesBetweenAlerts minutes. Obviously if a reason's requirement is no longer being met, then the alert will not be generated, also.
Technical info: the MinutesBetweenAlerts facility works by storing the date/time that each given item (instrument/timeframe/reason-for-alert) in a MT4 Global Variable. The current time is then compared to the stored time to determine whether the required number of minutes have elapsed since an alert for that item was generated. The values stored in Global Variables remain intact if a chart is refreshed, if the indicator is deattached and then reattached to a chart, or even if MT4 is stopped and restarted. The name of each Global Variable is
@LauraT_UniqueID_[symbolID,timeframe,reason-for-alert]
You can reset the alerts by clicking the 'Reset Alerts' button. This deletes all of the required Global Variables, effectively resetting the alerts (i.e. the starting time for MinutesBetweenAlerts is reset to 0). The comment message '== Alerts have been reset ==' will appear in the top left corner of the main price chart until the next price tick occurs.
Keep in mind that the purpose of alerts is merely to alert you to a possible condition as soon as it occurs. It is then left to you to view any relevant chart(s), wait for any suitable setups to materialize, and judge for yourself whether any of these merit an entry.
Troubleshooting tips
I can't check historical situations that have been and gone, and moreover, I don't have data from your broker, or info about your computer.
1. If alerts aren't reaching your email or phone:
(i) type Ctrl-O in MT4 to get the 'Options' panel and check that you have the correct settings in the Email and Notifications tabs. Contact your ISP or telecomms provider for help. I live in New Zealand and I have no knowledge of how telecomms operate in your country.
(ii) turn popup alerts on (set MinutesBetweenAlerts to 0, and type the message you want to get in MessageForPopupAlerts). If the alert is occurring correctly as a popup, but not as an email or push notification, then any fault is not with the indicator, because it handles all 3 alert types together and in exactly the same manner.
2. If you think an item (instrument/timeframe/reason) is missing from the alerts, or conversely, one is being alerted that shouldn't be, check the dashboard to see whether it's present there. Only items that are being highlighted in the dashboard can be alerted. And of course double check your alert settings in the dashboard indicator, after reading the instructions above carefully.
3. If you think an item is not being reported on the dashboard itself, or conversely, is being displayed on the dashboard when it shouldn't be, check the actual chart itself, with Laura's template applied.
If you want me to take a look with any of these, you'll need to provide screenshots of (i) your parameter settings for the dashboard indicator, (ii) the dashboard itself, and (iii) the chart with Laura's template. (And if the problem is alerts related, (iv) your popup alerts window). Obviously I don't have x-ray vision to see your computer from where I live. And I don't have the time, or want to invade your computer's privacy, by using some kind of remote viewing tool (like Team Viewer).
Installation files
Download the LauraT Roadmap Dashboard b600.ex4 indicator into your ...../MQL4/Indicators folder
Download the CompRSISelectv2.mq4 indicator into your ...../MQL4/Indicators folder
Then load MT4's Navigator (type Ctrl-N), and then right-click, and click Refresh.
The above files should now show under the 'Indicators' tree.
NOTE: The indicator uses symbols from both the Wingdings and Wingdings 3 fonts (there's a video on how to intstall fonts for Windows 10 here).
Attached File(s)