DislikedNow my next problem is the intent (perhaps what you mean is the gap and fade at fair value?) Although the no-brainer buy when above sell when below is a good picture of it, do candle stick patterns matter here?Ignored
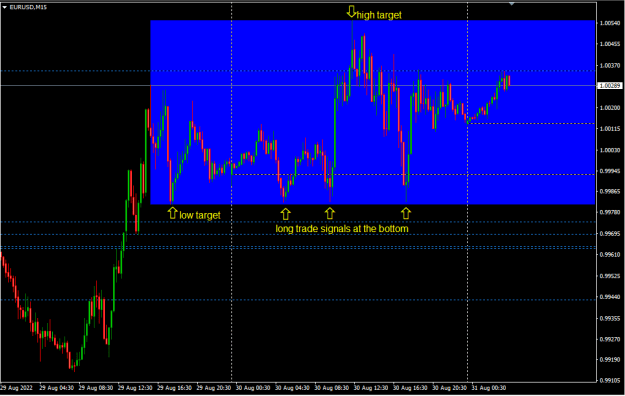
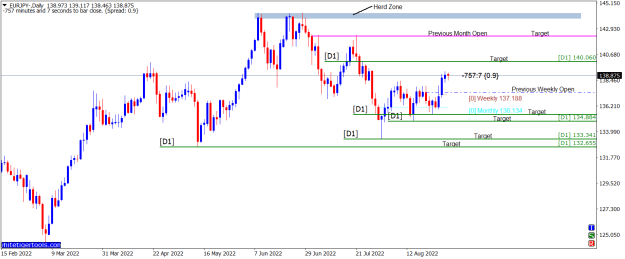
First is open lines and levels.
2nd is value intent.
It's a complicated chart because of the overlay of multiple hemispheres, dol, wol and mol. They all carry the same universal definition, the same applied across all time frames.
That's why I am able to do all that macro analysis of so many pairs in such quick time whatever time frame I switch to. I just require a glance at my phone. I watch the changing status across time as a series, both the macro and micro details. That's why the clock is important. Ofc the computer is better, but I don't waste time sitting in front of the computer all day long - chart staring pays time.
Candlestick is ohlc of one time frame. Candlestick pattern or correlation of raw ohlc data is meaningless to tell value intent - simple logic. Btw, candlestick is an indicator, the same ob/os spike indicator. Get rid of this indoctrination from your mind.
That's why I ask, what does the trader have in his toolkit to tell target levels and more important value intent?
For levels, the answer is pivot, fibs, mm...
Are you kidding?
What about intent?
Ob/os of some "indicator".
I'm sure you see the "indoctrination" problem now.
Wake up people, that's why ryuryu and RickM mock.
They shouldn't be rude, that's wrong.
Know what you trade
2