USDJPY Weekly Technical Outlook
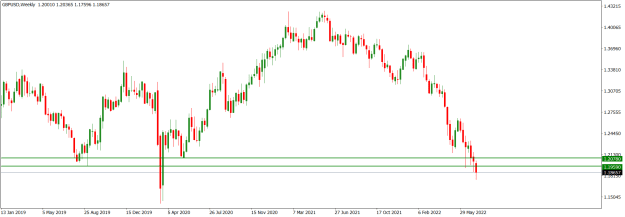
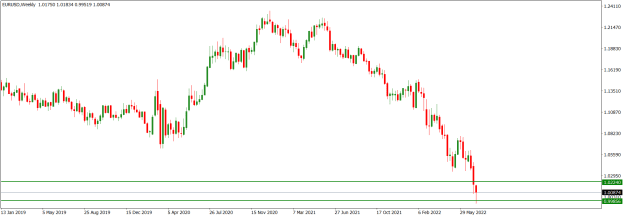
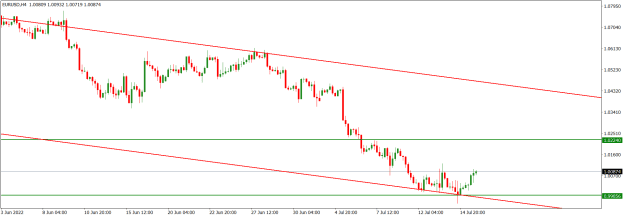
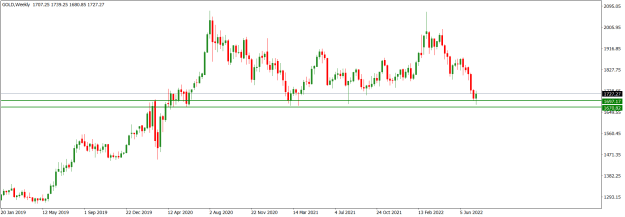
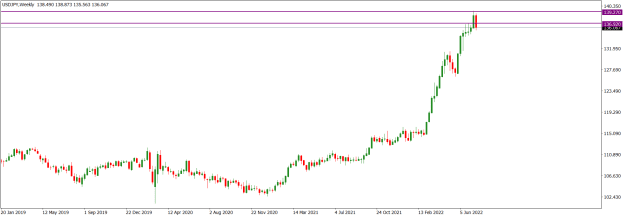
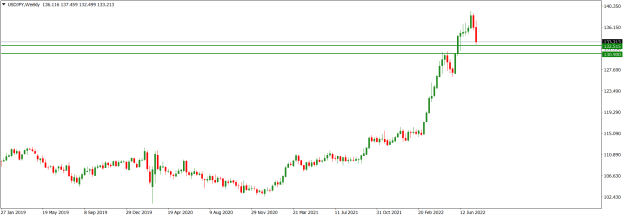
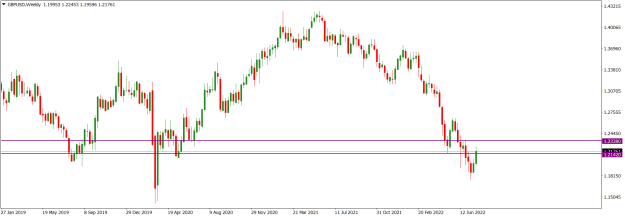
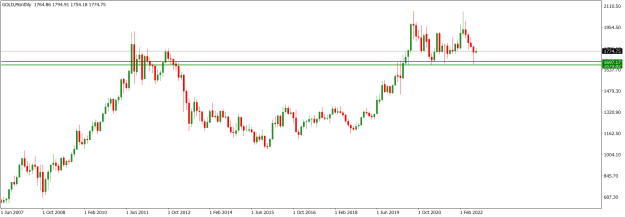
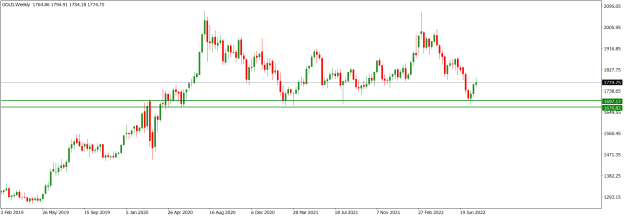
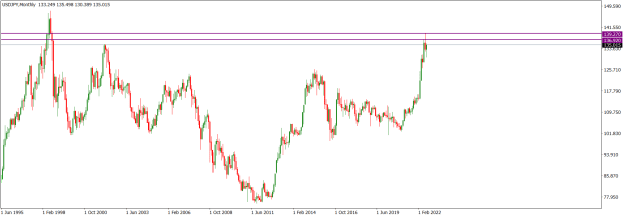
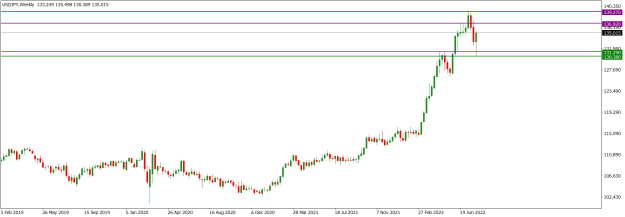
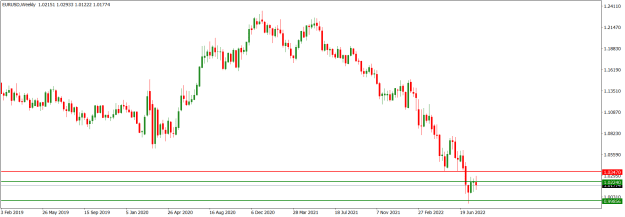
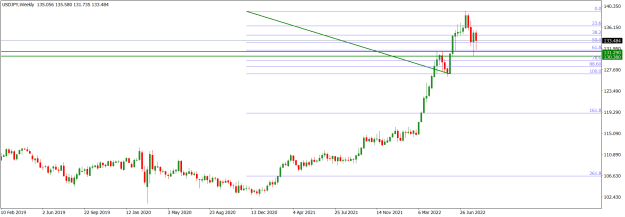
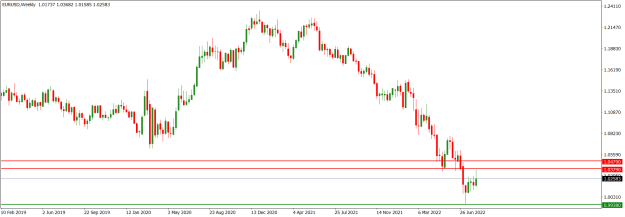
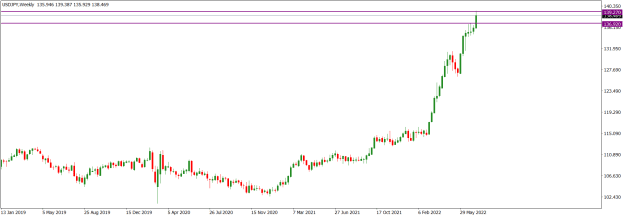
USDJPY market operation is bullish, but it is experiencing a decline in bullish momentum as it tackles the multi-year 136.920/139.270 horizontal resistance zone (purple). On the weekly time frame, last week, a relatively big bullish candlestick was printed in the zone. Until the last four weeks, the zone had not been visited since October 1998, and last week was the first time market operation closed within the zone. Meanwhile, bears are resisting the bullish attack on the zone, and this may hinder further bullish drive.
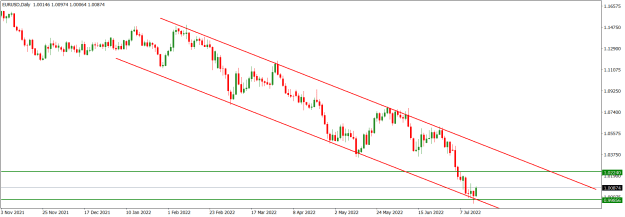
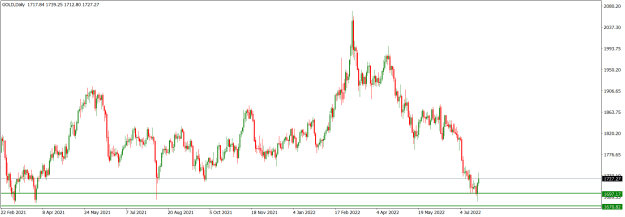
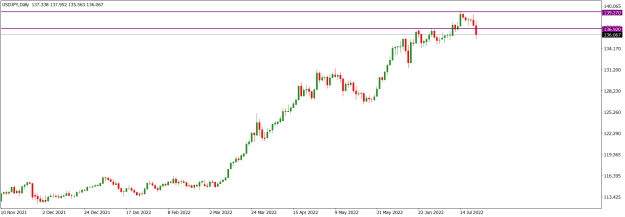
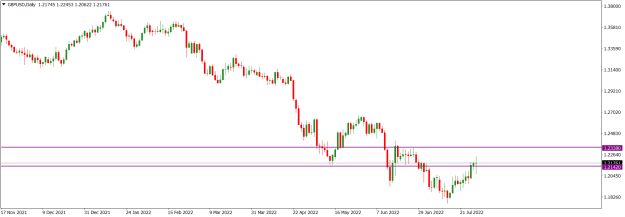
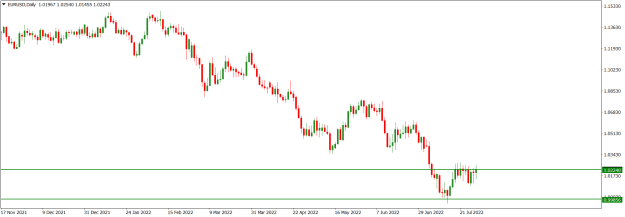
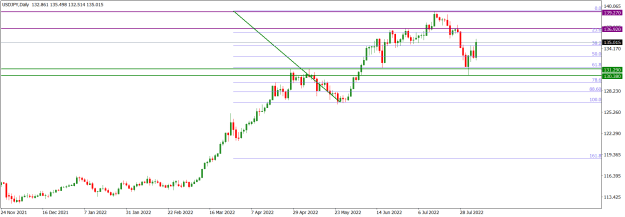
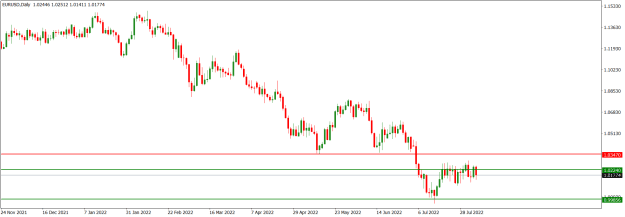
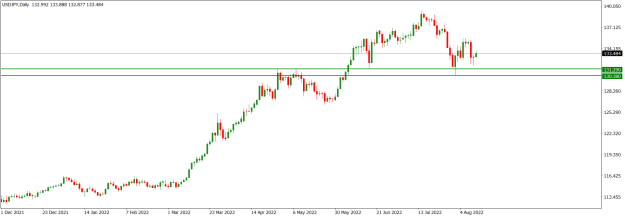
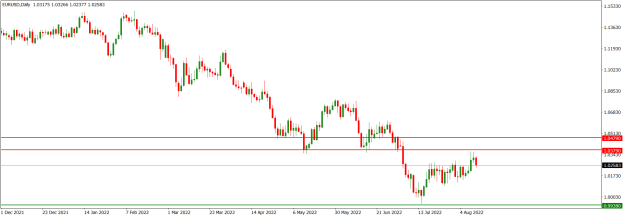
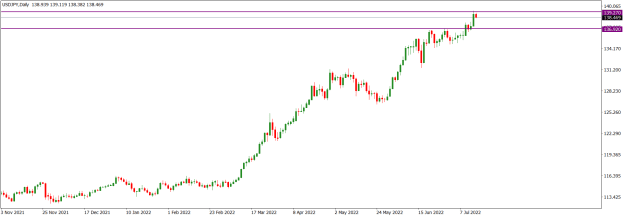
USDJPY price action on the daily time frame is tackling the multi-year 136.920/139.270 horizontal resistance zone (purple) seen on the weekly time frame. Although the technical structure is bullish, bears are resisting the bullish drive and, last week Friday, a relatively small bearish candlestick was printed in the zone. This portends the possibility of a bearish correction or a sideway of price action.
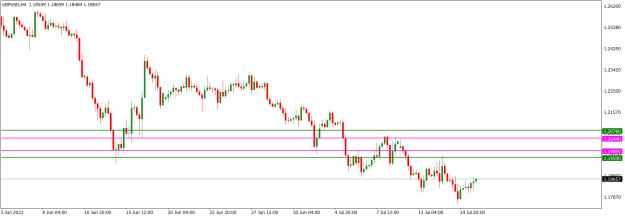
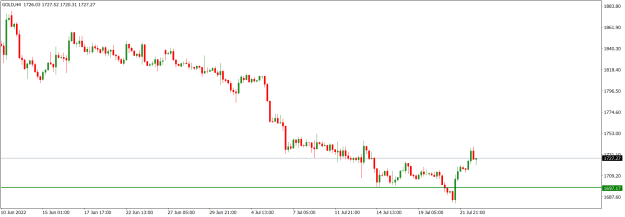
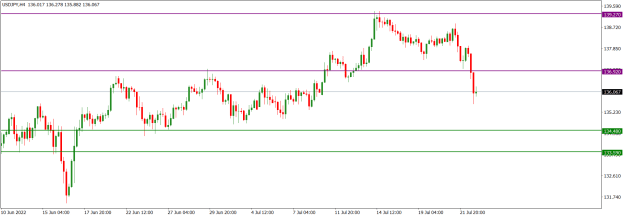
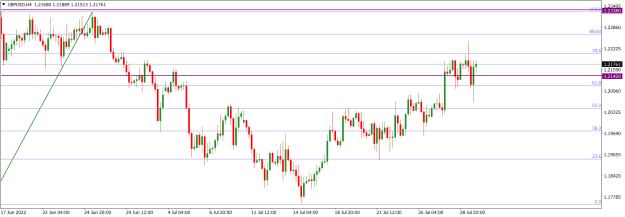
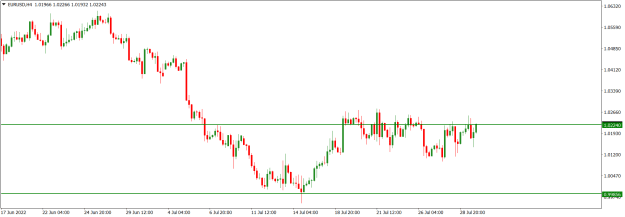
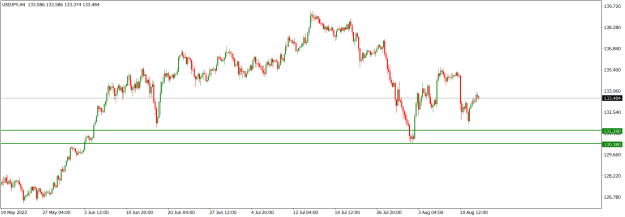
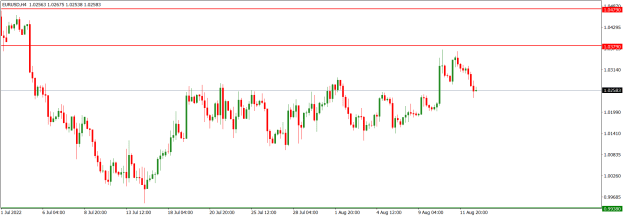
USDJPY price action on the H4 time frame is sideways in a technically bullish environment. As price action tackles the multi-year 136.920/139.270 horizontal resistance zone (purple) seen on the weekly time frame, we may see a bearish pullback. But this may not be sustained until a significant break down of the 136.920/139.270 horizontal resistance zone (purple).
I may be wrong. Trade safe and prosper.
KP
USDJPY market operation is bullish, but it is experiencing a decline in bullish momentum as it tackles the multi-year 136.920/139.270 horizontal resistance zone (purple). On the weekly time frame, last week, a relatively big bullish candlestick was printed in the zone. Until the last four weeks, the zone had not been visited since October 1998, and last week was the first time market operation closed within the zone. Meanwhile, bears are resisting the bullish attack on the zone, and this may hinder further bullish drive.
Attached Image (click to enlarge)
USDJPY price action on the daily time frame is tackling the multi-year 136.920/139.270 horizontal resistance zone (purple) seen on the weekly time frame. Although the technical structure is bullish, bears are resisting the bullish drive and, last week Friday, a relatively small bearish candlestick was printed in the zone. This portends the possibility of a bearish correction or a sideway of price action.
Attached Image (click to enlarge)
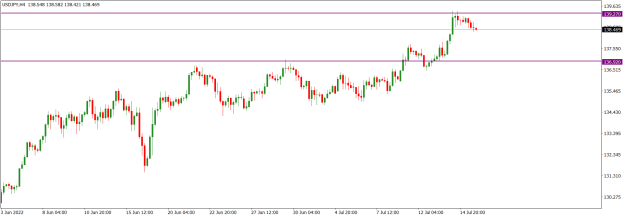
USDJPY price action on the H4 time frame is sideways in a technically bullish environment. As price action tackles the multi-year 136.920/139.270 horizontal resistance zone (purple) seen on the weekly time frame, we may see a bearish pullback. But this may not be sustained until a significant break down of the 136.920/139.270 horizontal resistance zone (purple).
Attached Image (click to enlarge)
I may be wrong. Trade safe and prosper.
KP
Do your homework, follow the footprints of smart money
1