Lines in trading.. Like all aspects of trading books could be written just on the subject of
lines and how to use them. As Viktor said and we all know pictures say alot. And as I had mentioned to Viktor statements etc can all be fudged and altered....
But what cant be altered is the charts...So if you want to learn or understand better or entertain different ideas charts of others are great tools.
So here are some charts that lay out 2 hard set data points. Time and Price...
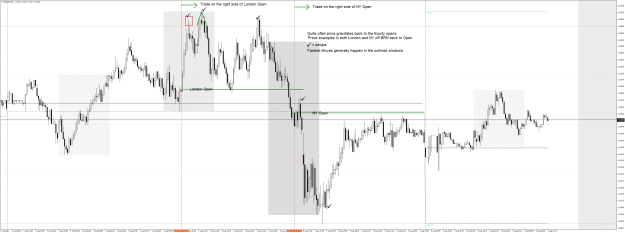
Now time is set in stone..The opens of the London Stock Market and the New York.
On my charts and most likely your MT4 charts thats 10:00 and 16:30.
As for price. It is the open price and thats it.
And those two data points are what I will share some charts highlighting them and let you draw your own conclusions. Keep in mind trade the appropriate pairs assets at the appropriate times....
ex. dont trade the NZD/YEN at the US Equity open and expect much..
The examples I am sharing are from the FTSE. So I use the LSE open of 10:00
The SPX or NQ or US30 I use 16:30....
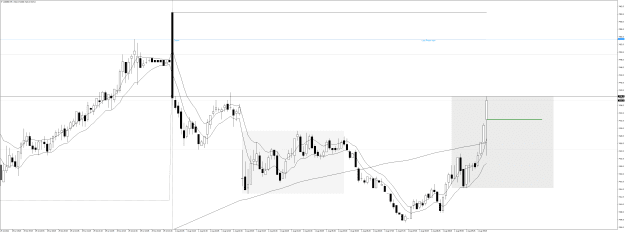
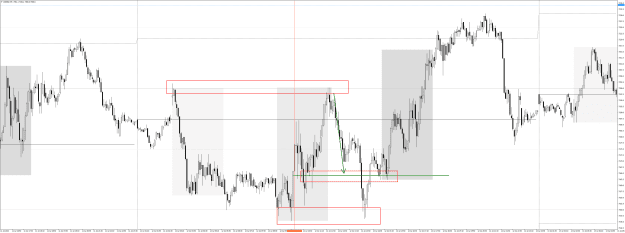
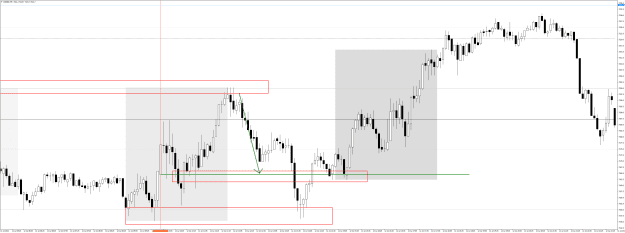
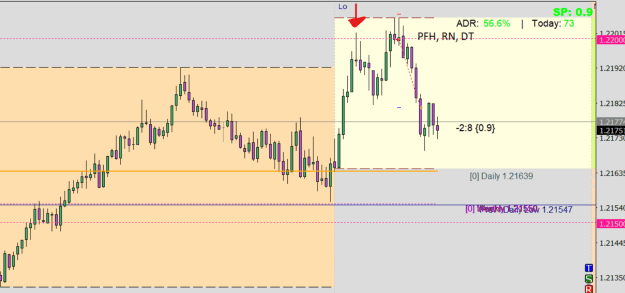
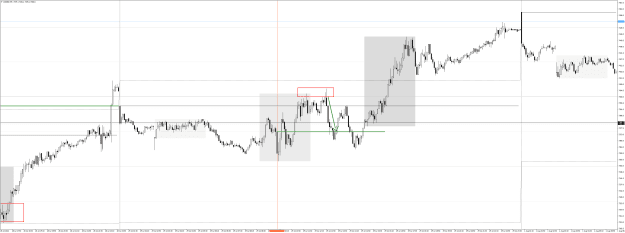
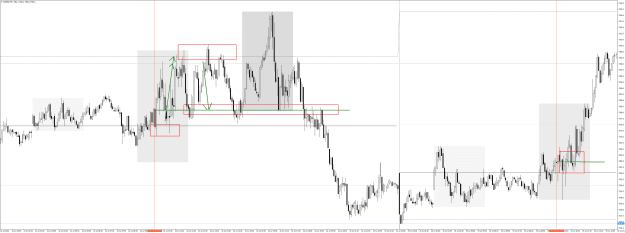
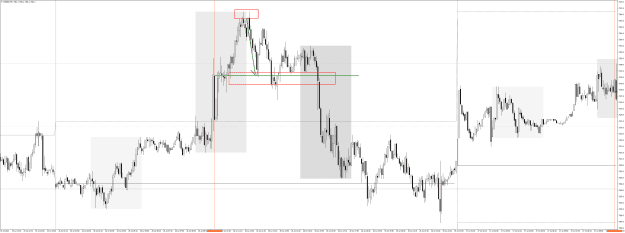
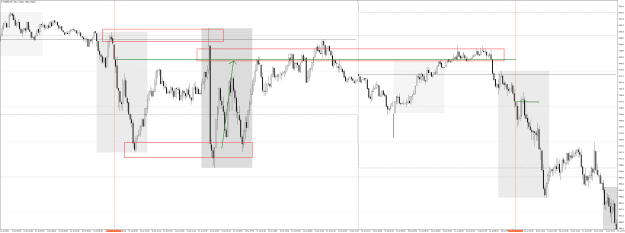
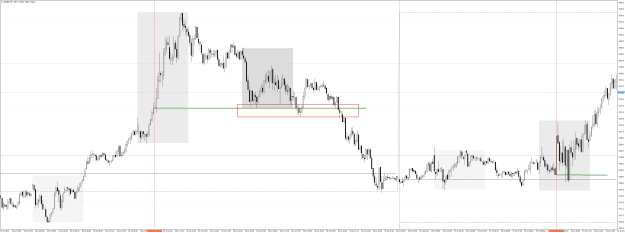
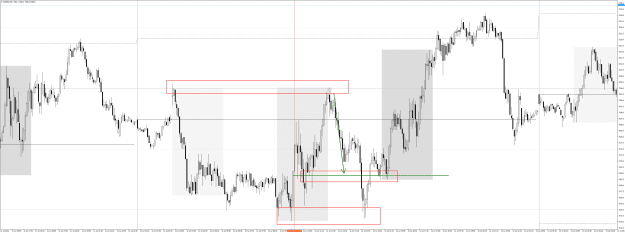
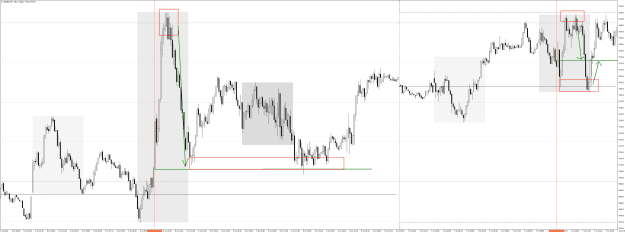
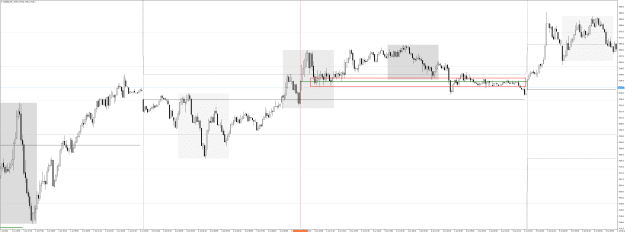
What you may see is how price reacts around the opening price of an asset...Thru out that sessions trading and quite often into the next sessions and even the next day.
You may wonder why price stops at an “unseen” level...quite often it is the price of that instrument at the opening of the coinciding equity open....
Like ALL Lines they can be used to trade to or from...Entries and targets etc. What is required to trade using lines is strategies deveoped around them... They dont work on their own. Context and Confluence always for your best setups/probabilitites. Price action..Patterns AND AND AND understandong Market Structure/Mechanics/Geometry....
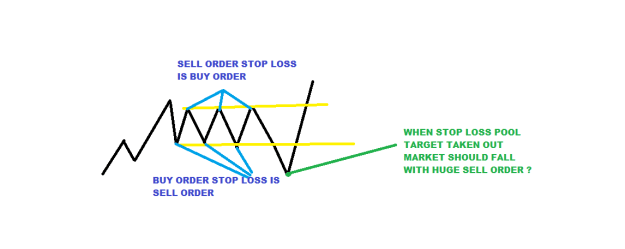
The markets intention is to take your money..It seeks liquidity...Its job is to take money from the many to the few. So look at the charts and think “where are the current profitable trades ?” Thats where price will go... MARKET MECHANICS... Anyways enough chatter
Hope some may get a lightbulb moment when they see how price at TIME OF OPEN will react to the days trading and how you can use it to your advantage..
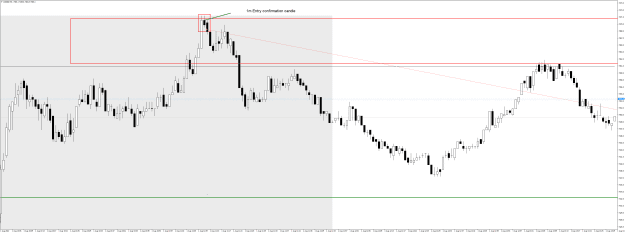
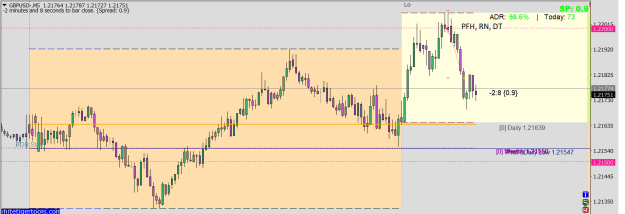
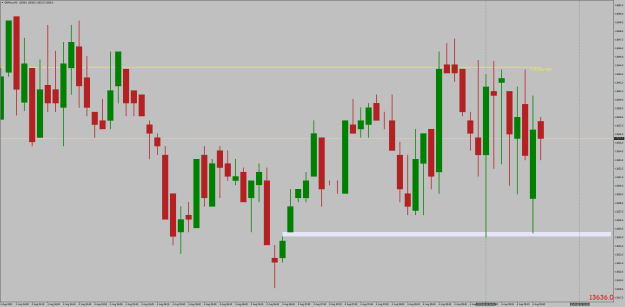
And lastly first chart is a trade from yesterdays UK session..The FTSE index 5 trades total 4 winners for a total of 100 points. Showing the trade history for the largest of the 4 winners....and the TARGET was the FTSE open price at TIME... LSE 10:00
All the best
Blue
And food for thought :
“The eight laws of learning are explanation, demonstration, imitation, repetition, repetition, repetition, repetition, repetition.” -John Wooden
Attachment g 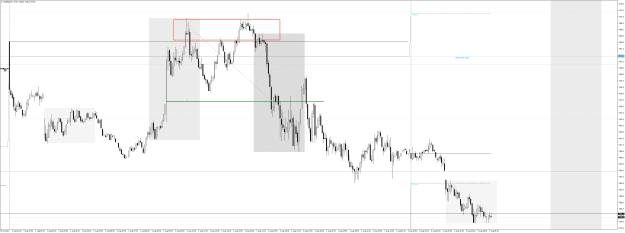

lines and how to use them. As Viktor said and we all know pictures say alot. And as I had mentioned to Viktor statements etc can all be fudged and altered....
But what cant be altered is the charts...So if you want to learn or understand better or entertain different ideas charts of others are great tools.
So here are some charts that lay out 2 hard set data points. Time and Price...
Now time is set in stone..The opens of the London Stock Market and the New York.
On my charts and most likely your MT4 charts thats 10:00 and 16:30.
As for price. It is the open price and thats it.
And those two data points are what I will share some charts highlighting them and let you draw your own conclusions. Keep in mind trade the appropriate pairs assets at the appropriate times....
ex. dont trade the NZD/YEN at the US Equity open and expect much..
The examples I am sharing are from the FTSE. So I use the LSE open of 10:00
The SPX or NQ or US30 I use 16:30....
What you may see is how price reacts around the opening price of an asset...Thru out that sessions trading and quite often into the next sessions and even the next day.
You may wonder why price stops at an “unseen” level...quite often it is the price of that instrument at the opening of the coinciding equity open....
Like ALL Lines they can be used to trade to or from...Entries and targets etc. What is required to trade using lines is strategies deveoped around them... They dont work on their own. Context and Confluence always for your best setups/probabilitites. Price action..Patterns AND AND AND understandong Market Structure/Mechanics/Geometry....
The markets intention is to take your money..It seeks liquidity...Its job is to take money from the many to the few. So look at the charts and think “where are the current profitable trades ?” Thats where price will go... MARKET MECHANICS... Anyways enough chatter
Hope some may get a lightbulb moment when they see how price at TIME OF OPEN will react to the days trading and how you can use it to your advantage..
And lastly first chart is a trade from yesterdays UK session..The FTSE index 5 trades total 4 winners for a total of 100 points. Showing the trade history for the largest of the 4 winners....and the TARGET was the FTSE open price at TIME... LSE 10:00
All the best
Blue
And food for thought :
“The eight laws of learning are explanation, demonstration, imitation, repetition, repetition, repetition, repetition, repetition.” -John Wooden
Attachment g
Attached Image (click to enlarge)
Attached Image (click to enlarge)
Attached Image (click to enlarge)
Attached Image (click to enlarge)
Attached Image (click to enlarge)
Attached Image (click to enlarge)
Attached Image (click to enlarge)
Attached Image (click to enlarge)
Attached Image (click to enlarge)
Attached Image (click to enlarge)
Markets are Mirrors,,Mastery of craft is mastery of self
9