DAILY TF
Candles is GBP USD
Line is EUR USD
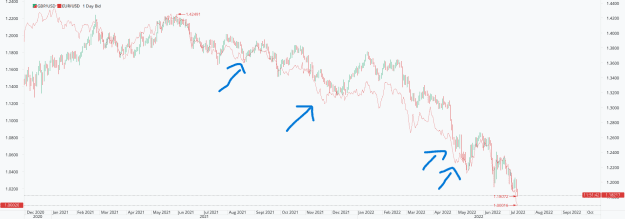
For what I see, everytime it's been GBP USD finally weakening to "reach" EUR USD.
At least, this happens since march 2020 (didn't check earlier).
This indeed means that EUR is weaker than GBP (eurgbp value is in fact in downtrend since march 2020). But also means that both EUR and GBP are affcted by USD strength.
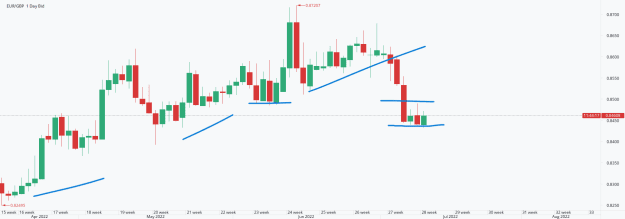
At time of writing EUR GBP daily chart show possible range .84-.85 so I would not be surprised to see EUR stopping for a while near parity, but GBP weakening 30 to 70 pips further
Candles is GBP USD
Line is EUR USD
Attached Image (click to enlarge)
For what I see, everytime it's been GBP USD finally weakening to "reach" EUR USD.
At least, this happens since march 2020 (didn't check earlier).
This indeed means that EUR is weaker than GBP (eurgbp value is in fact in downtrend since march 2020). But also means that both EUR and GBP are affcted by USD strength.
Attached Image (click to enlarge)
At time of writing EUR GBP daily chart show possible range .84-.85 so I would not be surprised to see EUR stopping for a while near parity, but GBP weakening 30 to 70 pips further
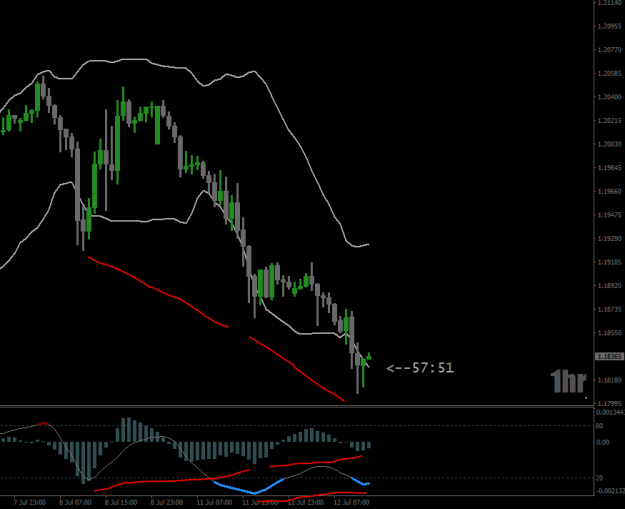
90% of traders use TA, indicators and prediction
1