XAUUSD Weekly Technical Outlook
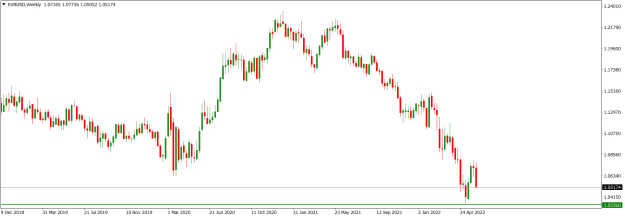
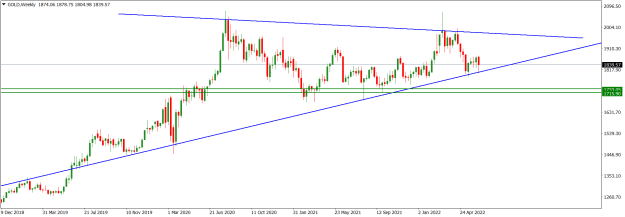
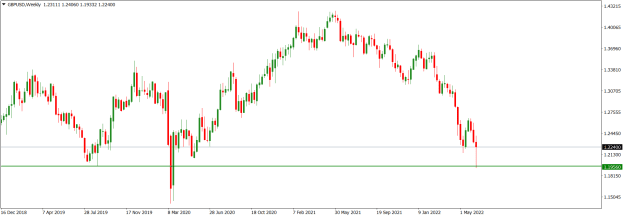
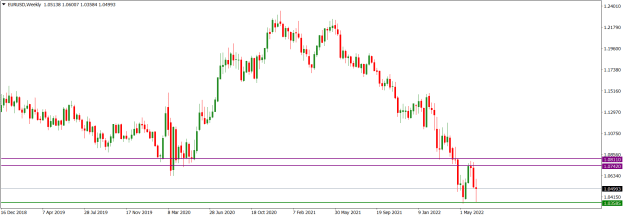
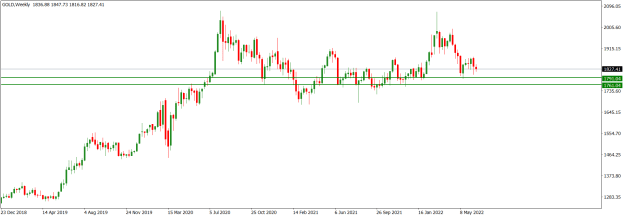
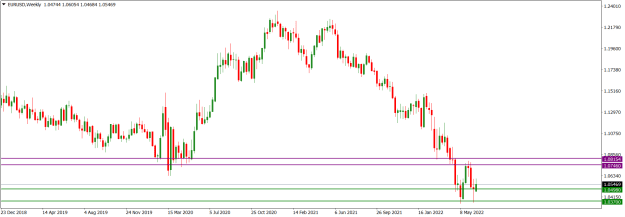
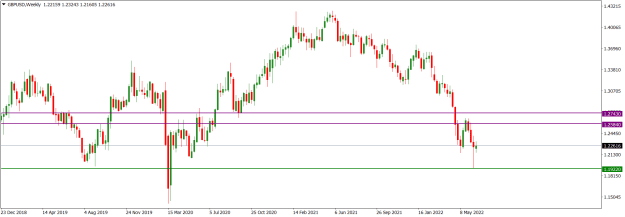
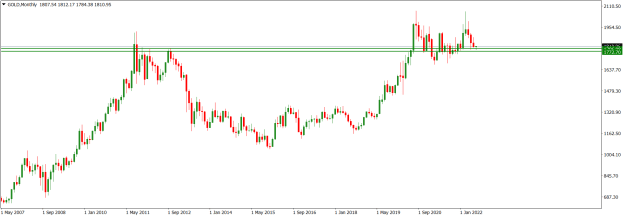
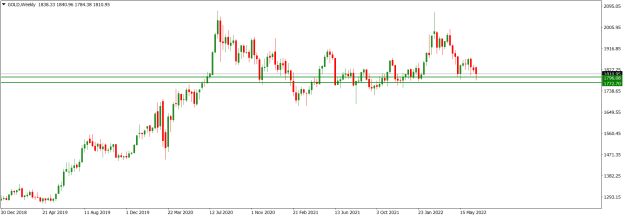
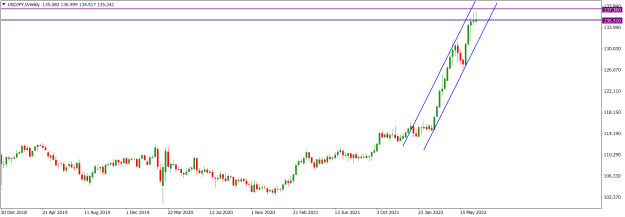
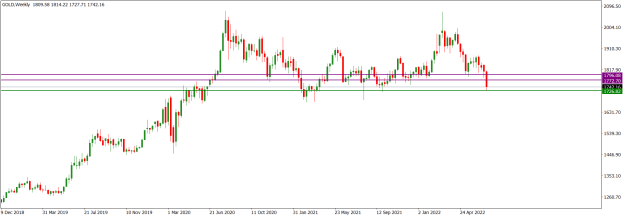
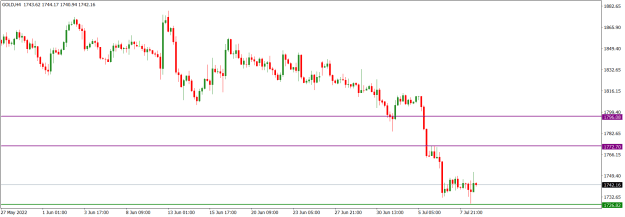
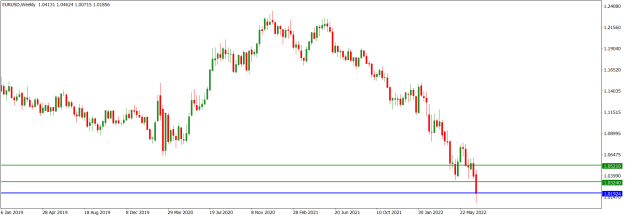
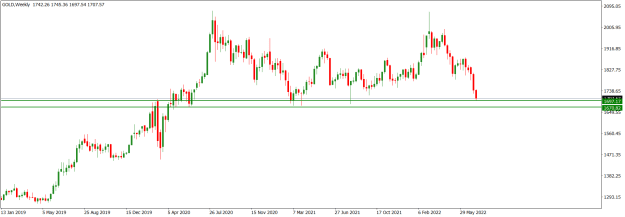
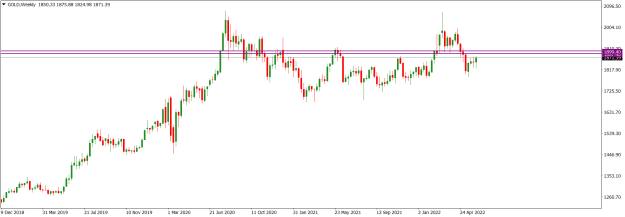
XAUUSD market operation broke down the 1899.40/1887.40 horizontal support zone (purple) five weeks ago. Meanwhile, on the weekly time frame, market operation is in a bullish retracement of the bearish drop. We may still see further bullish move before a bearish turnaround.
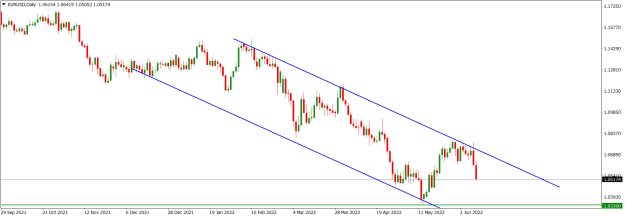
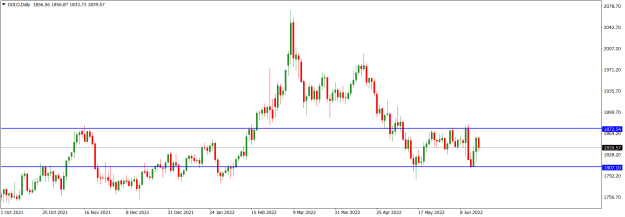
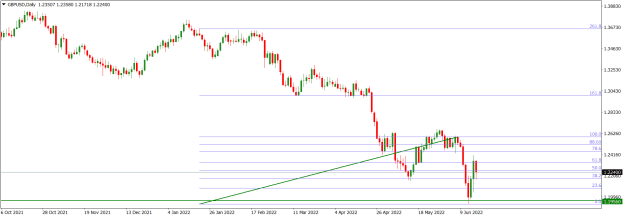
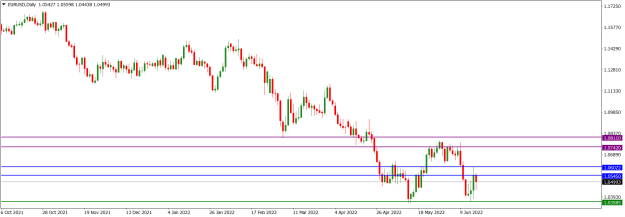
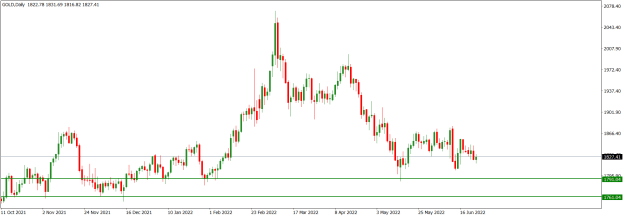
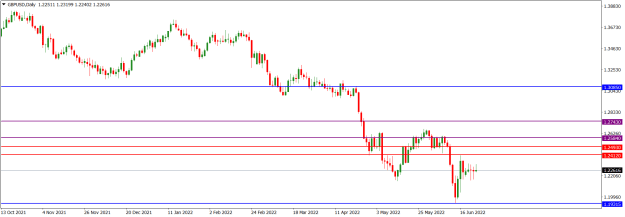
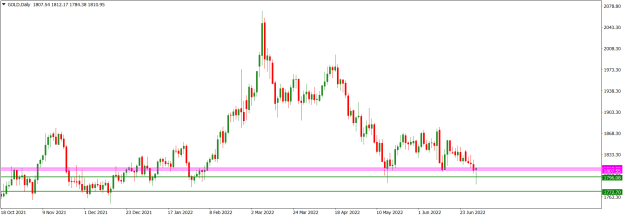
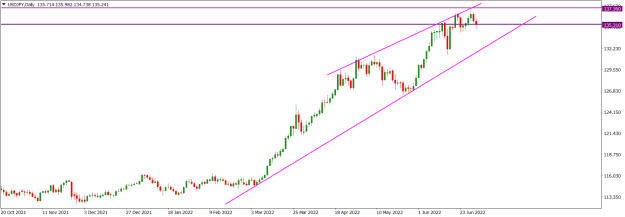
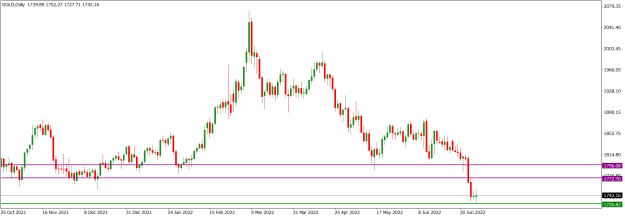
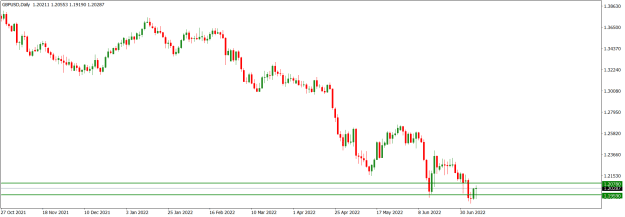
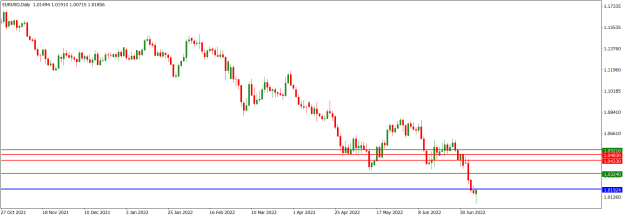
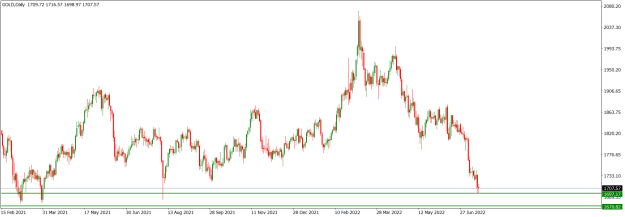
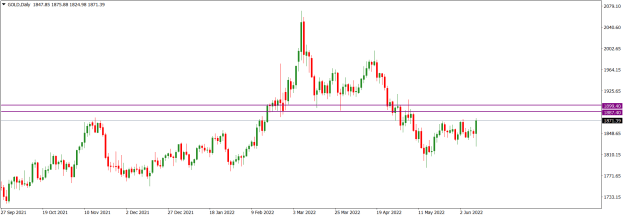
XAUUSD price action on the daily time frame is making a bullish retracement of the 1998.32/1786.60 bearish swing. The bullish continuation candlestick printed on Friday broke above a consolidation area that was in place for five days, and we may see further northward move to an area of value, such as the broken down 1899.40/1887.40 previous horizontal support area (purple), before a southward rotation.
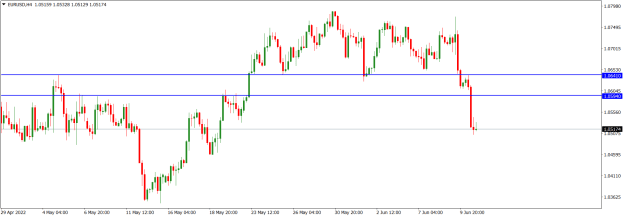
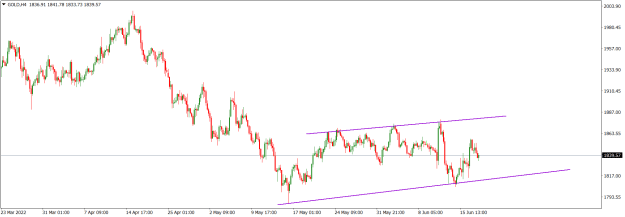
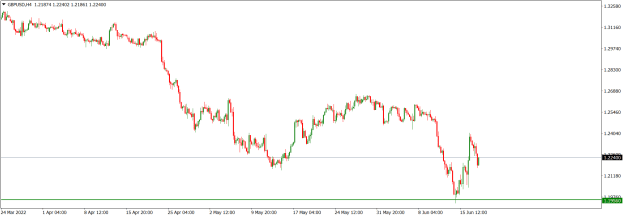
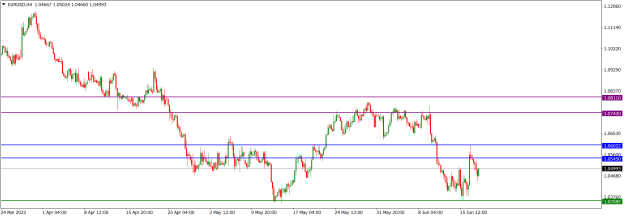
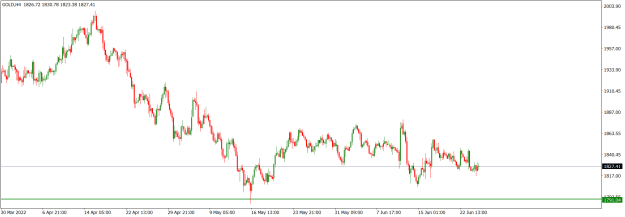
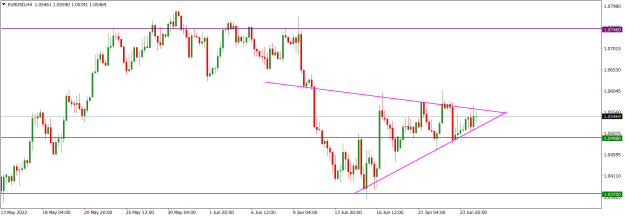
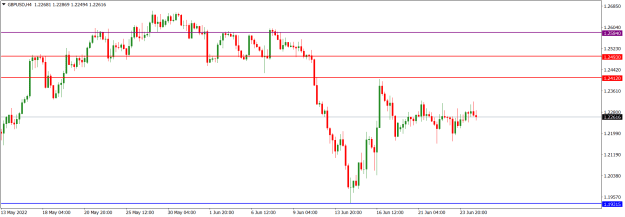
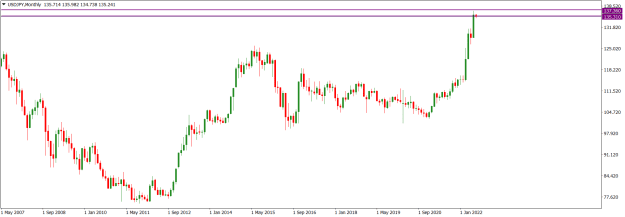
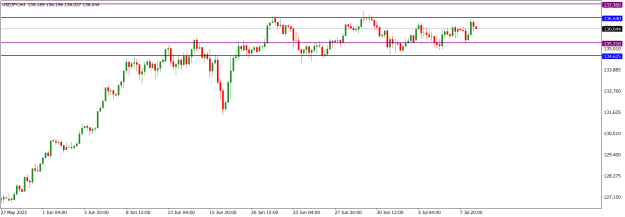
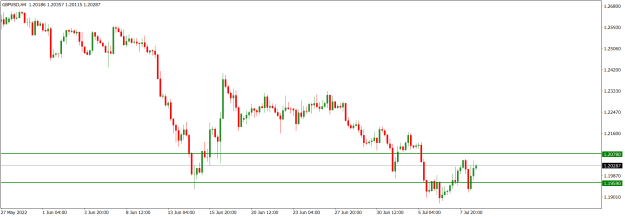
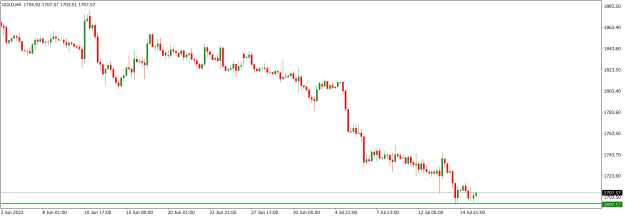
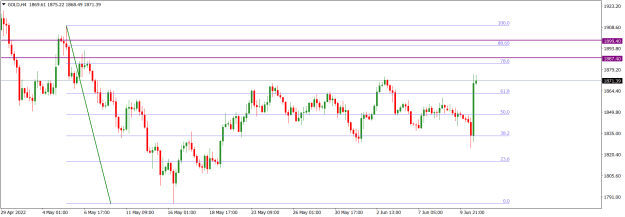
XAUUSD price action on the H4 time frame is in 61.8/78.6 zonal retracement of the 1909.68/1786.60 bearish swing. We may soon see a bearish turnaround, particularly as the larger technical environment is bearish.
I may be wrong. Trade safe and prosper.
KP
XAUUSD market operation broke down the 1899.40/1887.40 horizontal support zone (purple) five weeks ago. Meanwhile, on the weekly time frame, market operation is in a bullish retracement of the bearish drop. We may still see further bullish move before a bearish turnaround.
Attached Image (click to enlarge)
XAUUSD price action on the daily time frame is making a bullish retracement of the 1998.32/1786.60 bearish swing. The bullish continuation candlestick printed on Friday broke above a consolidation area that was in place for five days, and we may see further northward move to an area of value, such as the broken down 1899.40/1887.40 previous horizontal support area (purple), before a southward rotation.
Attached Image (click to enlarge)
XAUUSD price action on the H4 time frame is in 61.8/78.6 zonal retracement of the 1909.68/1786.60 bearish swing. We may soon see a bearish turnaround, particularly as the larger technical environment is bearish.
Attached Image (click to enlarge)
I may be wrong. Trade safe and prosper.
KP
Do your homework, follow the footprints of smart money