USDJPY Weekly Technical Outlook
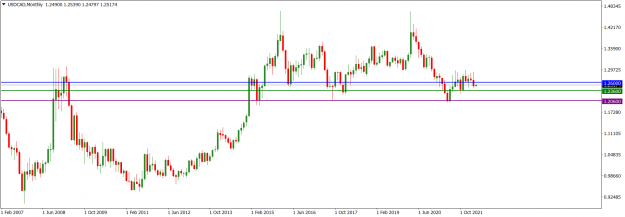
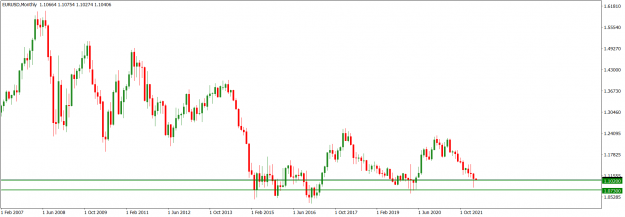
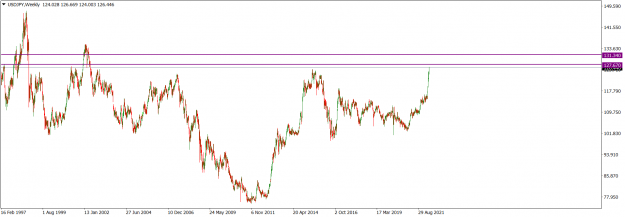
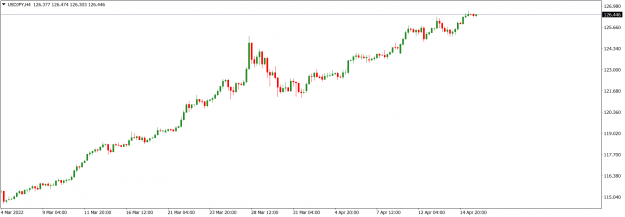
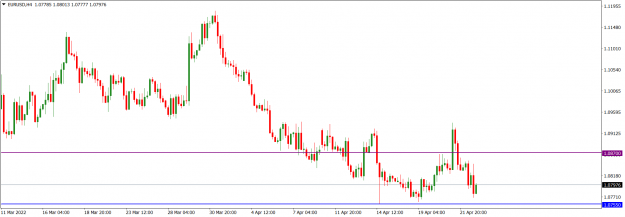
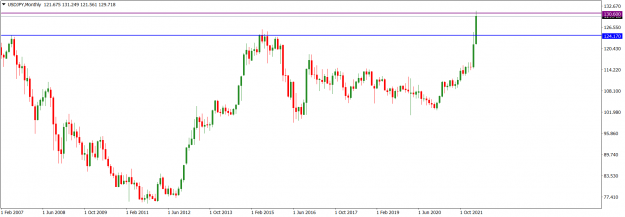
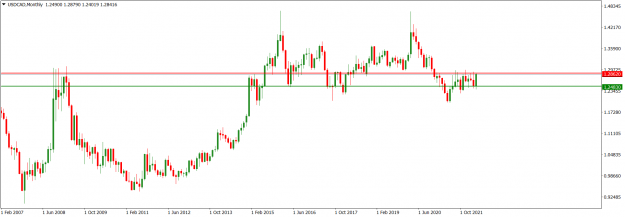
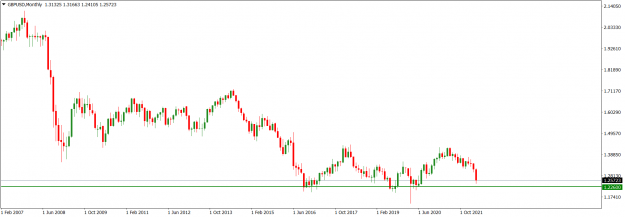
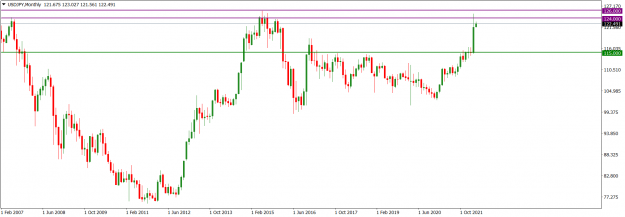
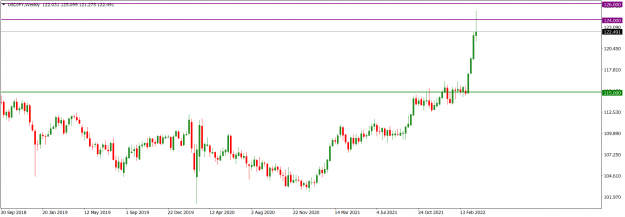
Technically, the USDJPY market is bullish. On the monthly time frame, market operation printed a relatively big bullish candlestick in March and flipped the 115.00 area (green) as horizontal support – the first time the area was breached northward since February 2017. The March bullish market operation surged to the 124.00/126.00 multi-year horizontal resistance area (purple) before retracing, resulting in the printing of a bullish candlestick with a relatively significant top-shadow; which indicates bearish pressure.
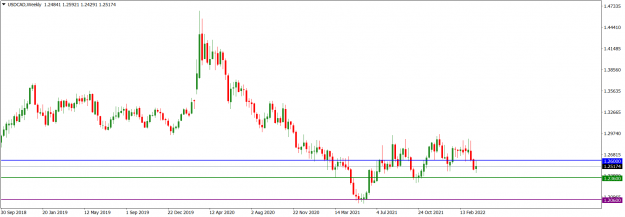
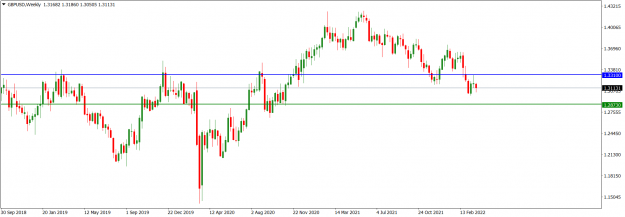
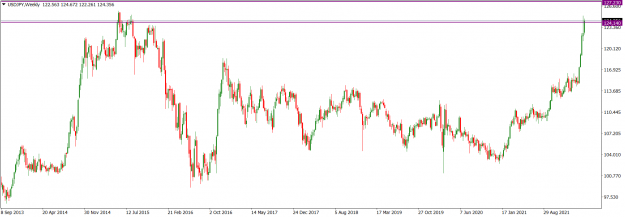
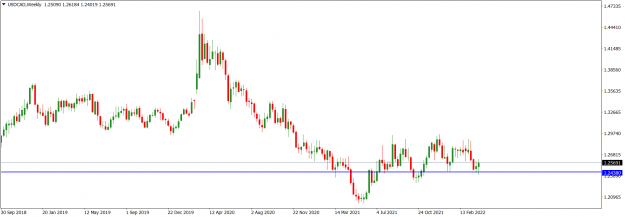
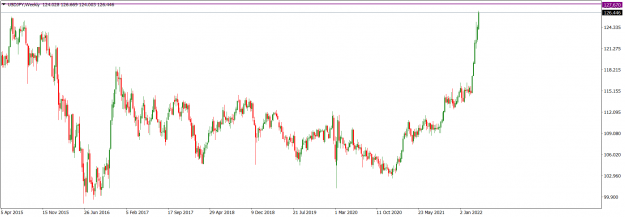
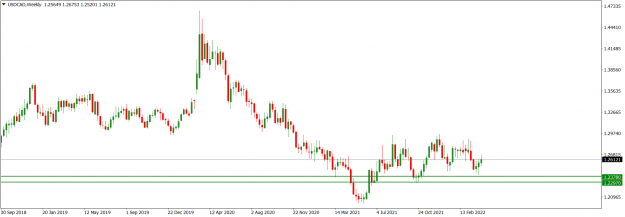
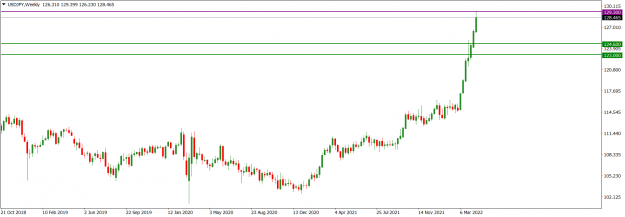
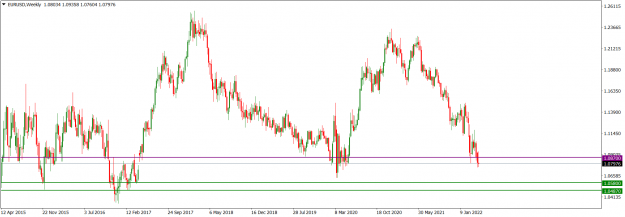
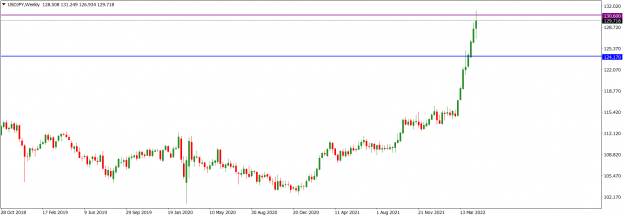
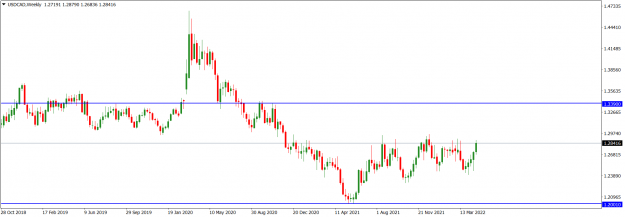
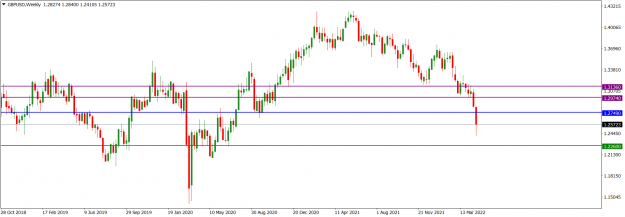
USDJPY market operation on the weekly time frame is bullish. However, it is experiencing bearish pressure. Last week, bulls drove market operation into the 124.00/126.00 multi-year horizontal resistance area (purple) but the move was resisted by bears, resulting in the printing of a bullish candlestick with long upper tail more than 150 pips below the zone. Nevertheless, we may see bulls make another attempt to regain market control in the early part of this week.
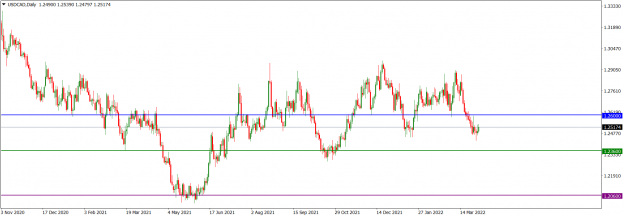
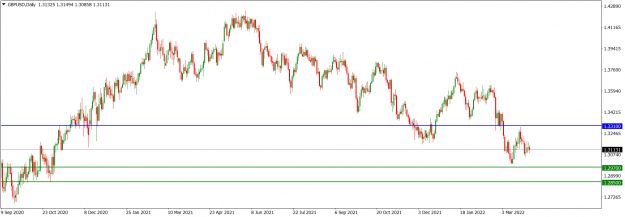
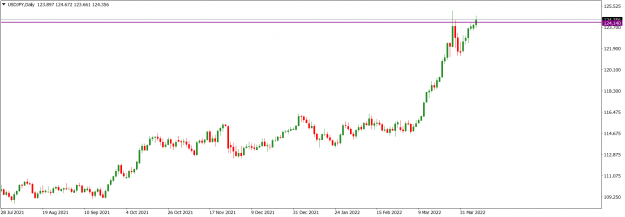
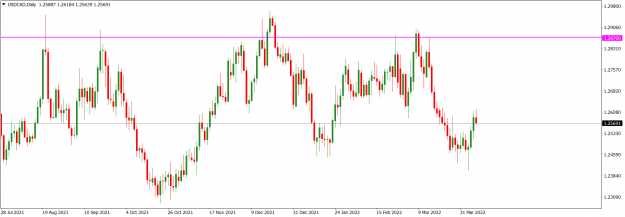
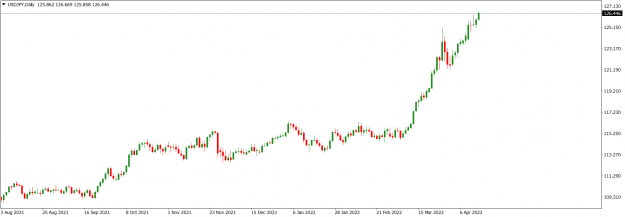
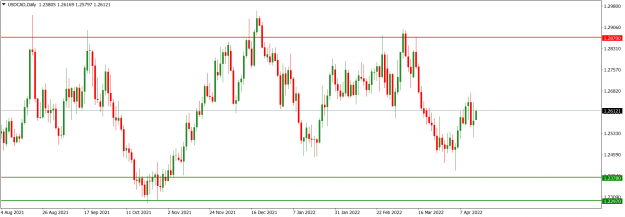
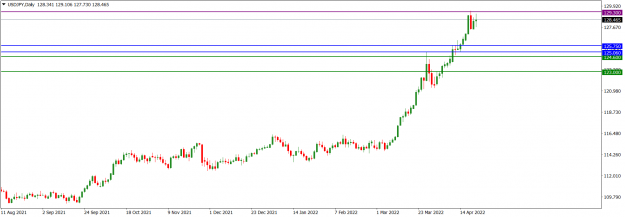
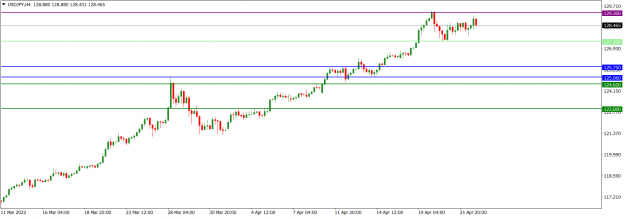
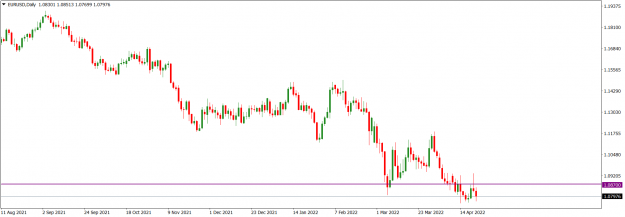
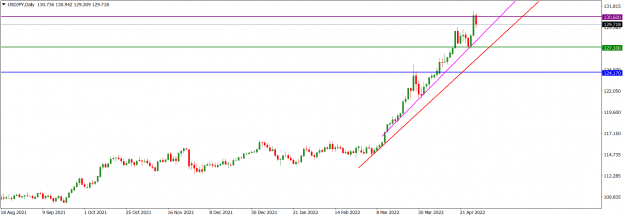
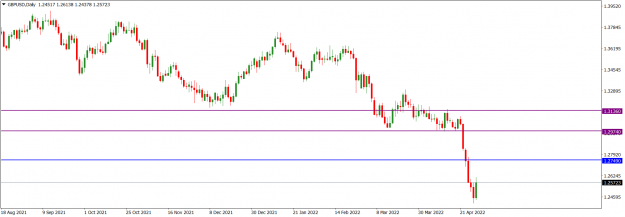
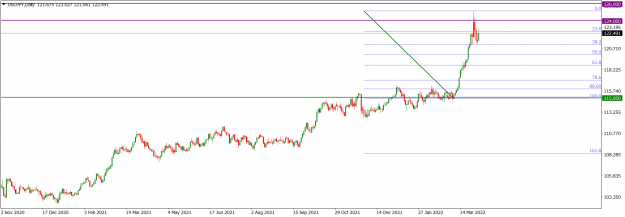
USDJPY price action on the daily time frame turned sideways after making 38.2 Fib retracement of the bullish 114.80/125.10 swing. Should bulls regain market control, we may see further northward market engineering in the early part of this week. The 124.00/126.00 area (purple) is a multi-year horizontal resistance.
I may be wrong. Trade safe and prosper.
KP
Technically, the USDJPY market is bullish. On the monthly time frame, market operation printed a relatively big bullish candlestick in March and flipped the 115.00 area (green) as horizontal support – the first time the area was breached northward since February 2017. The March bullish market operation surged to the 124.00/126.00 multi-year horizontal resistance area (purple) before retracing, resulting in the printing of a bullish candlestick with a relatively significant top-shadow; which indicates bearish pressure.
Attached Image (click to enlarge)
USDJPY market operation on the weekly time frame is bullish. However, it is experiencing bearish pressure. Last week, bulls drove market operation into the 124.00/126.00 multi-year horizontal resistance area (purple) but the move was resisted by bears, resulting in the printing of a bullish candlestick with long upper tail more than 150 pips below the zone. Nevertheless, we may see bulls make another attempt to regain market control in the early part of this week.
Attached Image (click to enlarge)
USDJPY price action on the daily time frame turned sideways after making 38.2 Fib retracement of the bullish 114.80/125.10 swing. Should bulls regain market control, we may see further northward market engineering in the early part of this week. The 124.00/126.00 area (purple) is a multi-year horizontal resistance.
Attached Image (click to enlarge)
I may be wrong. Trade safe and prosper.
KP
Do your homework, follow the footprints of smart money