|
Joined Dec 2008
|
Status: MMA Pro Wrestler
|17,556 Posts
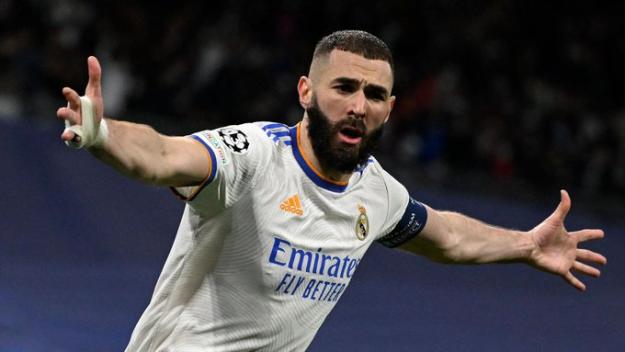
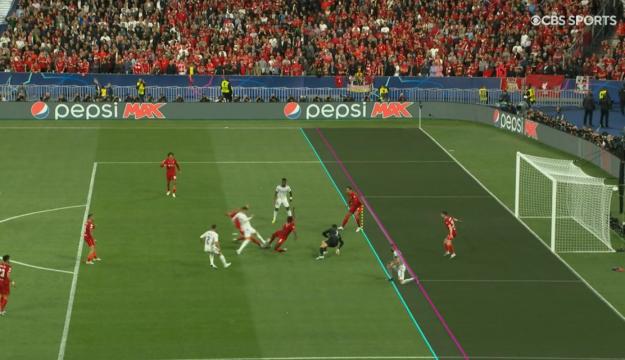
Should Karim Benzema's goal have counted?
This is cheating... Not happy with Ref
The ball to Benzema does not come from Valverde, it hits Fabinho's knee therefore that's not a pass to Benzema from his teammate and shouldn't be counted as offside.
{quote} Congratulations to Madrid, today I stop to be a football fan as the pain is too much for me to bear despite not earning a cent from it.
Ignored
No mate...don't do that...this is football!!! Keep loving your team, Liverpool is one of the greatest teams in Europe so you should be proud .
Forza PAOK Thessaloniki
You are allowed to fall but you are imposed to get up!
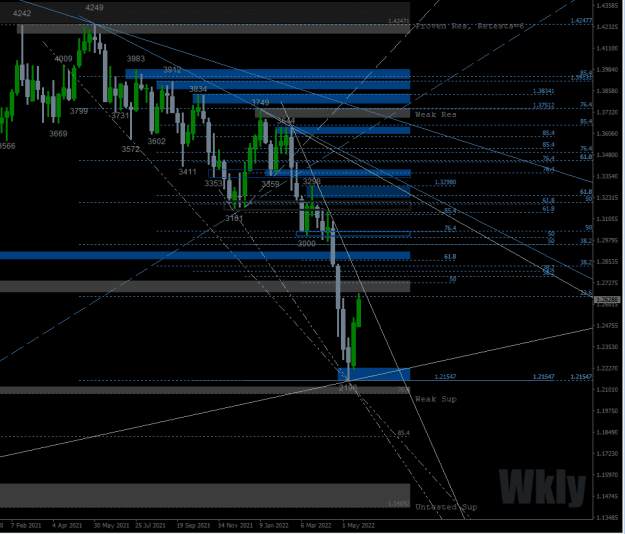
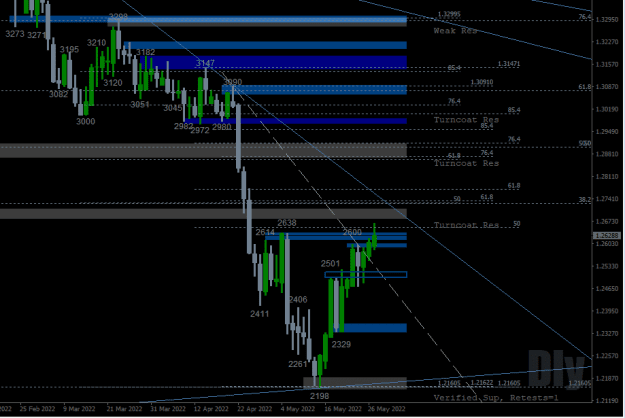
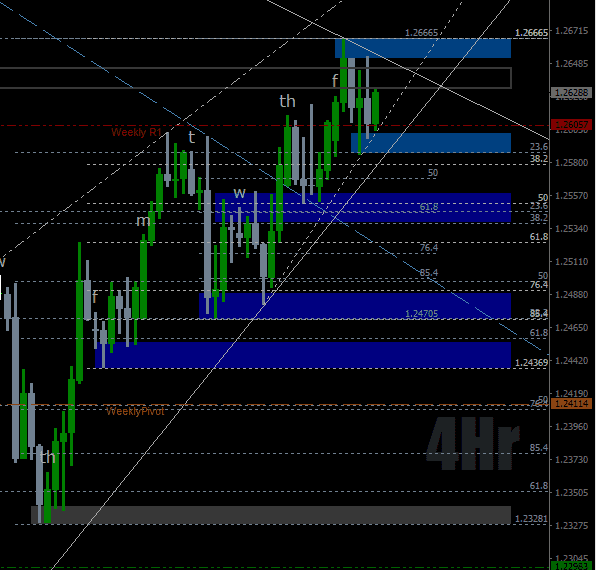
* Bullish Wkly close but this t/f remains in a general downtrend after 6 consecutive LH's. First potential upside obstacle on this t/f the prev sw lo (from May 2020) @ 2675-circa 2735 = prev supp = pot sbr through which a descending (desc) t/line runs (also a 4 fib cluster 2724-34.) * Friday's Dly candle closed with a bullish body although looks like it could be a hammer with a longish rejection upper wick? The t/f is, per 3 candle fractal swing analysis , in a classic uptrend therefore re its recent signs of strength - with a HL @ 2329, a H @ 2501, a HH @ 2600, and what will be a 2nd HH when it forms fractally.@ 2666 or higher, that high going above the last significant pullback hi of it's former downtrend @ 2638. First potential upside obstacle on this t/f is as above but on this t/f the zone runs from 2675-circa 2708. That desc t/line mentioned above comes through on Monday's Dly candle circa 2740-45.
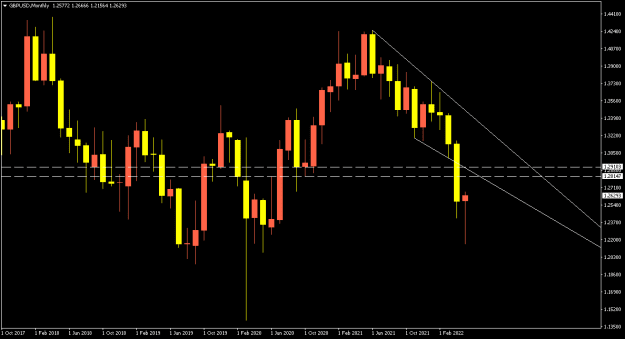
NB: 2198-2666 is the 2nd longest sustained pullback in the mthly/wkly downtrend since the top of the trend @ 4249
* Last 4Hr close was a bullish engulf, ( on the gmt+2 4hr candle.) The t/f closed the week in a general uptrend with what are 7 consecutive HL's now. The first potential upside obstacle on this t/f is the desc t/line that joins 3990 with 2666 and just above that the prev 1hr/minor 4hr sw hi zone to that 2666 hi = prev res = pot res.
------------------------------------------------------------------- So, we are seeing a new longer-term uptrend begin to establish itself, or just a sustained pullback in the wkly/mthly downtrends.
Light week re historically market-moving data release event risks coming up, other than potentially U.s NFP etc on Friday. Thurs and Fri are the 'Jubilee' Bank Hols in the U.k so overall market liquidity/volume will likely suffer on those days.
{quote} Congratulations to Madrid, today I stop to be a football fan as the pain is too much for me to bear despite not earning a cent from it.
Ignored
Sorry Georginson. It was a big disappointment for Liverpool team and it's fans, especially with security issues at the gates, delay and entrance disaster, unacceptable bad prepared really. Would not like to be one of them behind the gates.
Liverpool had a successful season. Game was pleasure to watch. Liverpool played good , during first half they took control over the game and had a few chances to score, but been unfortunate.
Second place is a close attempt after many years, hopefully next season.
{quote} Congratulations to Madrid, today I stop to be a football fan as the pain is too much for me to bear despite not earning a cent from it.
Ignored
Take it easy man, we watch football for fun and entertainment, yes we get hurt emotionally when our favourite team loses, however, we need to remind ourselves there are always winners and losers and your team cannot vi the winner each and every time (except if its real madrid lol joking)
Enjoy the rest of the weekend and lets start a fresh week full of successful trades in monday