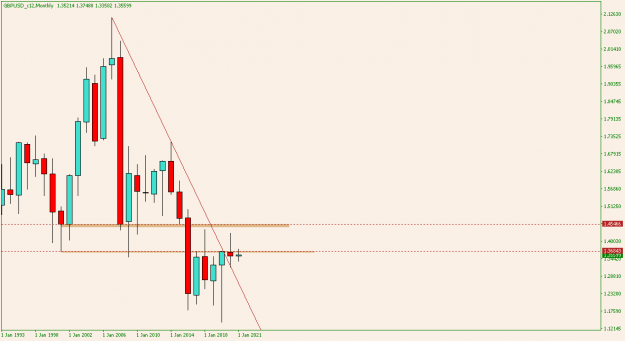
playing with 3month chart. came up off support, with some line structures above and below {image}
Ignored
Hey Trumps
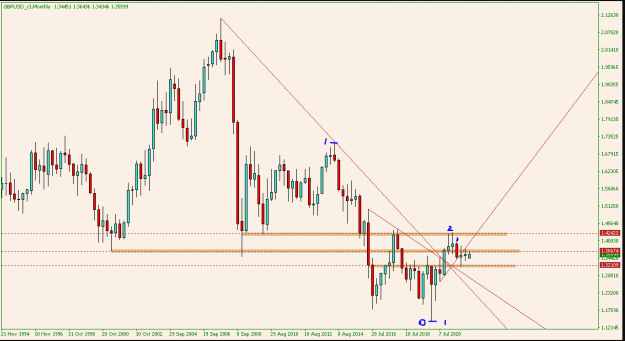
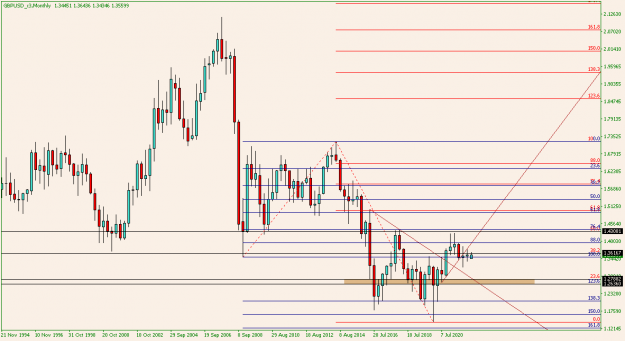
can you draw a fib on these points (1 to 0) and (1 to 2) highlighted lets see what levels price is sitting at? Maybe could give us a clue..
I see a "Walmart" formed. Levels 1.3664 and 1.32109 are significant as price would try to range at these levels for sometime or ever throughout the year! Who knows.
The reversal red candle forced price to 1,32109 level and we see a rejection from that level too and now failing to break the upper level of 1.3664.
Lets play around it this wkend although its a f***** 3 month chart.
Attached Image (click to enlarge)
Grit; Knowledge; Right Mindset; All you need to overcome. KIS!
{quote} Hey Trumps can you draw a fib on these points (1 to 0) and (1 to 2) highlighted lets see what levels price is sitting at? Maybe could give us a clue.. I see a "Walmart" formed. Levels 1.3664 and 1.32109 are significant as price would try to range at these levels for sometime or ever throughout the year! Who knows. The reversal red candle forced price to 1,32109 level and we see a rejection from that level too and now failing to break the upper level of 1.3664. Lets play around it this wkend although its a f***** 3 month...
Ignored
When I get the chance.
You can draw fibs?
I'm on phone
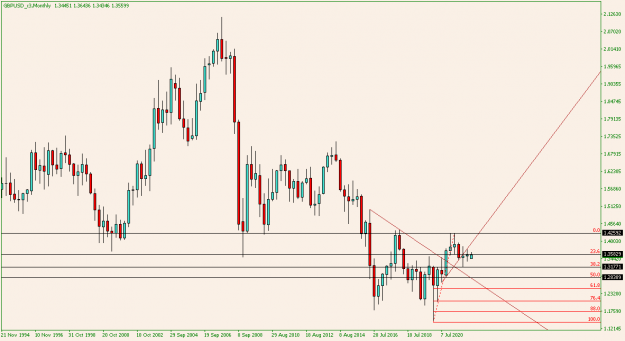
12 month. Has retested the major line, but we have been unable to close above the 2020 hammer {image}
Ignored
we have been unable to close above the 2020 hammer
That is because the MN1 and MN2 are in a pullback to the bigger up swing. After the pullback ends, then the up continuation will get well above that hammer.
{quote} Hey Trumps can you draw a fib on these points (1 to 0) and (1 to 2) highlighted lets see what levels price is sitting at? Maybe could give us a clue.. I see a "Walmart" formed. Levels 1.3664 and 1.32109 are significant as price would try to range at these levels for sometime or ever throughout the year! Who knows. The reversal red candle forced price to 1,32109 level and we see a rejection from that level too and now failing to break the upper level of 1.3664. Lets play around it this wkend although its a f***** 3 month...
Ignored
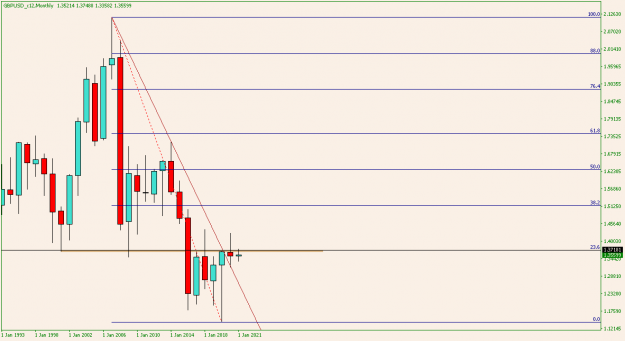
To me, that starting 1 down to 0 seems to be an odd place to draw a Fib. I would look at the Nov. 2007 bar to the Sep. 2016 bar (or could even choose Feb. 2020, it won't matter). That is likely the Y3 down swing, and it is probably finished. So the upswing that you marked from 1-2 is highly likely the start of a new up trend, not a mere rally, and the drop from point 2 is a pullback in progress.
{quote} we have been unable to close above the 2020 hammer That is because the MN1 and MN2 are in a pullback to the bigger up swing. After the pullback ends, then the up continuation will get well above that hammer.
{quote} Hey Trumps can you draw a fib on these points (1 to 0) and (1 to 2) highlighted lets see what levels price is sitting at? Maybe could give us a clue.. I see a "Walmart" formed. Levels 1.3664 and 1.32109 are significant as price would try to range at these levels for sometime or ever throughout the year! Who knows. The reversal red candle forced price to 1,32109 level and we see a rejection from that level too and now failing to break the upper level of 1.3664. Lets play around it this wkend although its a f***** 3 month...
12 month. Has retested the major line, but we have been unable to close above the 2020 hammer {image}
Ignored
Hi trumps,
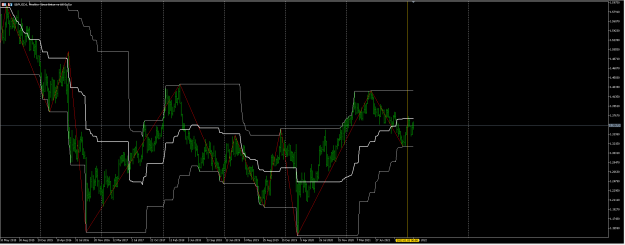
since your chart is 12months candle, the current candle is a LIVE candle and has 10 months to go for close, you can not base your decisions or reading on live candle unless closed.
a weekly chart with period separator show 1 year/52 bars.
an indicator like Donchian Channel calculate high/low/50% of a period close (in this case 52 is the setting)
a ZZ with 13 setting give you the reading(HHHL-LHLL) of 3 months (1/4 of a year)
Attached Image (click to enlarge)
from the chart you can see last year high broke per 2 years highs 2019-2020 but not 2018.
last year low gave you HL reading, if it holds, next reading should be HH.
"major line" you mentioned was the 50% of last year.
draw fib levels of last year so you can trade (if you wish) any lower TF based on year levels.
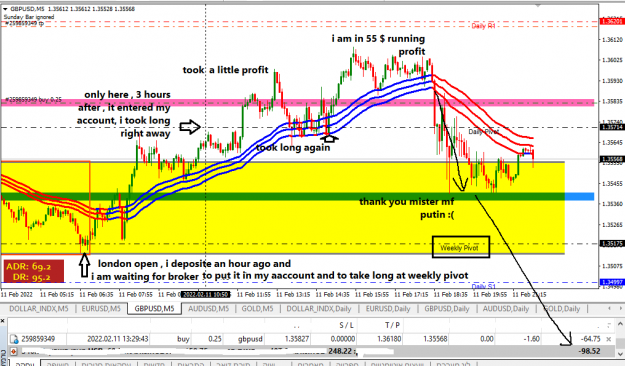
the problem is instead i will gain 55 pips at London open and then some more
what happened is my deposite was update after the big move that i expected , and i catch only little after it
and then i unluckily caught in a crush caused by mister mf Putin tweet about attacking Ukraine
{quote} Hi trumps, since your chart is 12months candle, the current candle is a LIVE candle and has 10 months to go for close, you can not base your decisions or reading on live candle unless closed. a weekly chart with period separator show 1 year/52 bars. an indicator like Donchian Channel calculate high/low/50% of a period close (in this case 52 is the setting) a ZZ with 13 setting give you the reading(HHHL-LHLL) of 3 months (1/4 of a year) {image} from the chart you can see last year high broke per 2 years highs 2019-2020 but not 2018. last...
Ignored
Your ZZ swings are marking off the MN1/MN2 swings. So, it is clear that MN3 with MN12 doesn't tell enough of the story: You need to check Y2 and Y3 as well. In fact, you should really look at the full historical record to see the down trend from about 1972-1985, then the up trend from 1985-2008, then down trend from 2008-2020.
And, as I said before, it is highly likely that this down trend has ended and a new up trend is in progress. Of course, because currently MN2 is most likely in a mere pullback, more time must unfold to determine if it remains a mere pullback, or if the swing up was actually just another rally rather than the start of the reversal.
Also, I think that making an arbitrary decision to trade based on yearly levels is very illogical. Swings do not adhere to some calendar-based schedule. Such a system will be cutting into the the middle of long swings and missing shorter swings. For example, from the 2020 low in March is the start of the MN8 up swing and possibly even the MN16. And when does that swing end? So far, it has ended as far as the MN2 in June of 2021; we don't know yet for any of the higher TFs. Of course it is POSSIBLE to create a trading system using the prior year's H/L, but I think it would not be very simple and need a lot of rules.
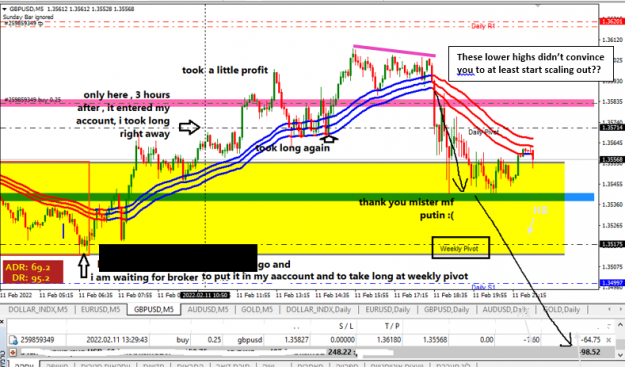
I think that luck had a minor role in it.
what about scaling out when new highs can't be reached? Or setting a trailing stop? No luck needed to do either of those.
{quote} Your ZZ swings are marking off the MN1/MN2 swings. So, it is clear that MN3 with MN12 doesn't tell enough of the story: You need to check Y2 and Y3 as well. In fact, you should really look at the full historical record to see the down trend from about 1972-1985, then the up trend from 1985-2008, then down trend from 2008-2020. And, as I said before, it is highly likely that this down trend has ended and a new up trend is in progress. Of course, because currently MN2 is most likely in a mere pullback, more time must unfold to determine if...
Ignored
I'm trying to be closest to his mindset my friend
no point in using advanced measurements since no one is interested in math
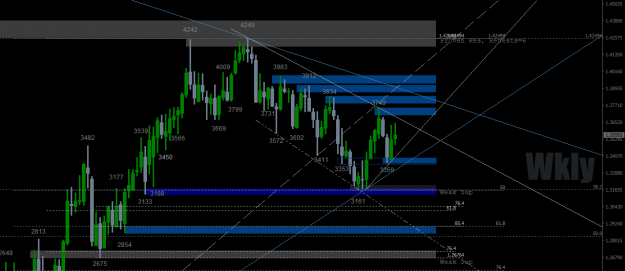
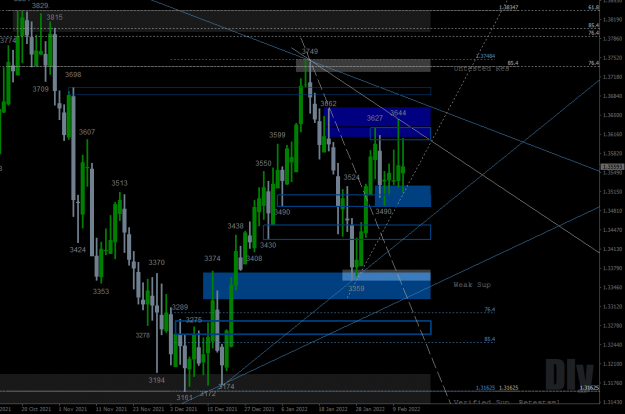
If Friday's Dly and the Wkly candle just closed could talk they might say 'we are undecided this week having tried going down and up, but are mildly bullish.' Ie the candles are both essentially indecision candles in and of themselves, with small bullish bodies. It was a 'pump and dump' scenario on both thurs and fri particularly.
* Dly - LL, H, HL and HH are the last few fractal prints on Dly so more bullish than bearish but no uptrend yet. * Wkly - After 4 consecutive LH's we now have a HL, so still trending down but showing recent signs of strength on this t/f. * 4Hr - a mess lol - rangy.
As suggested in my last post the prev 4hr/dly/minor wkly sw lo zone down to 3490 and the prev 4hr/dly sw hi zone to 3662 are the immediate potential supp and res zones respectively that contains the rangy conditions on 4hr and below, ie effectively 3603-62 to the upside, and 3522-3490 to the downside.
If the Russia/Ukraine thing kicks off for real this coming week, and if history is anything to go by, we will likely see a flight to safety/risk off scenario play out, at least in the short-term. Busy week coming up re data with U.s PPi, Retail sales, and Fomc minutes, and Uk Cpi/Rpi/PPi and Retail sales, being the probable highlights.
Will be trading Mon-Weds and then still hoping to go away for 2 weeks on Thurs.
{quote} I'm trying to be closest to his mindset my friend no point in using advanced measurements since no one is interested in math zoomed out {image} zoomed in {image} cheers,
Ignored
no point in using advanced measurements since no one is interested in math
1. Who is using advanced measurements???? I simply said look at swings! No measurements needed for that.
2. You are clearly wrong in stating that no one is interested in math.
And your copious lines on the chart mean nothing to anyone if you don't give some information about what they are. Swings, on the other hand, are learned in Trading 101.
If Friday's Dly and the Wkly candle just closed could talk they might say 'we are undecided this week having tried going down and up, but are mildly bullish.' Ie the candles are both essentially indecision candles in and of themselves, with small bullish bodies. It was a 'pump and dump' scenario on both thurs and fri particularly. * Dly - LL, H, HL and HH are the last few fractal prints on Dly so more bullish than bearish but no uptrend yet. * Wkly - After 4 consecutive LH's we now have a HL, so still trending down but showing recent signs of strength...
{quote} Hi trumps, since your chart is 12months candle, the current candle is a LIVE candle and has 10 months to go for close, you can not base your decisions or reading on live candle unless closed. a weekly chart with period separator show 1 year/52 bars. an indicator like Donchian Channel calculate high/low/50% of a period close (in this case 52 is the setting) a ZZ with 13 setting give you the reading(HHHL-LHLL) of 3 months (1/4 of a year) {image} from the chart you can see last year high broke per 2 years highs 2019-2020 but not 2018. last...
Ignored
Hi Kwt4x,
I'm not making any decisions at this point, simply pointing out that the hammer has not yet had a close above it.
There are other things on my chart that hint at my bias, but I am flat right now, waiting for more clarity.
We can go up and down the TF's to look for Sup/Res/TL clues, then look lower TF's for some form of signal.
That's what I'm doing.
Cheers
{quote} no point in using advanced measurements since no one is interested in math 1. Who is using advanced measurements???? I simply said look at swings! No measurements needed for that. 2. You are clearly wrong in stating that no one is interested in math. And your copious lines on the chart mean nothing to anyone if you don't give some information about what they are. Swings, on the other hand, are learned in Trading 101.
Ignored
measurements are needed to organize everything.
the fractal system is waves within waves, my original 3M reading will be within the Y2 Y3 that you suggested, so, we are both right. but inside the year smaller readings are more tradable.
I don't see much of math charts, that's the reason of my comment. I don't mind to be wrong.
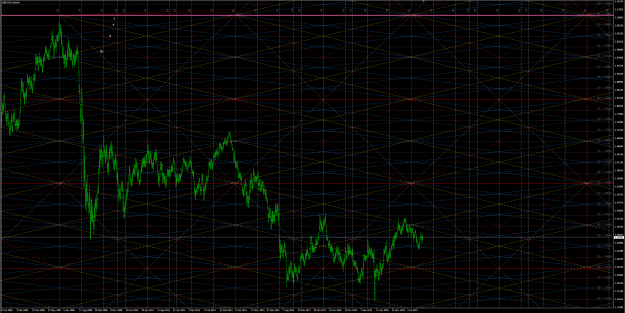
posting the chart was not to explain it, I was agreeing with you on historical swing reading. but to explain it, it's full 360 cycles of 2 4 8 and 16 angled grids.