Jim Tillman and Double Bottoms
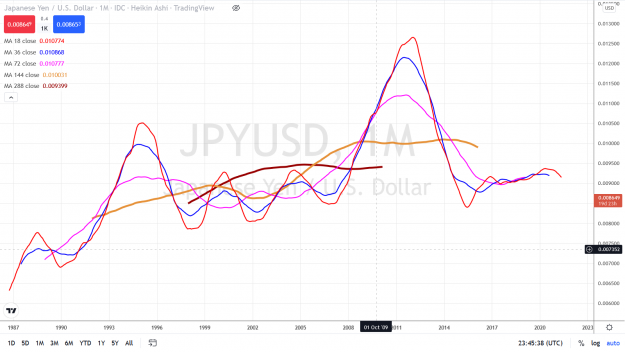
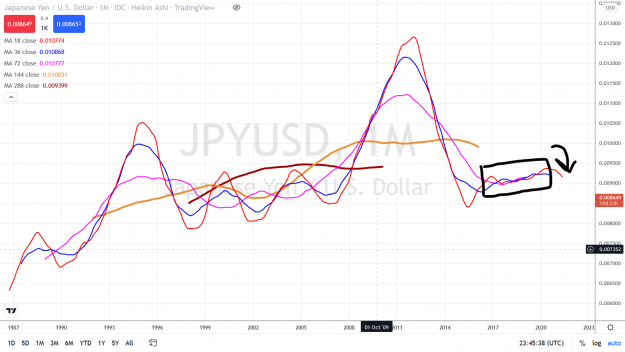
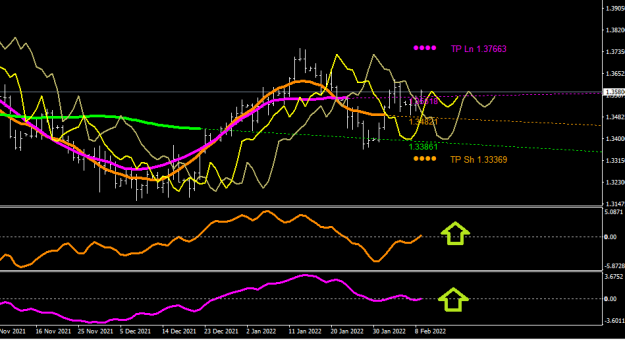
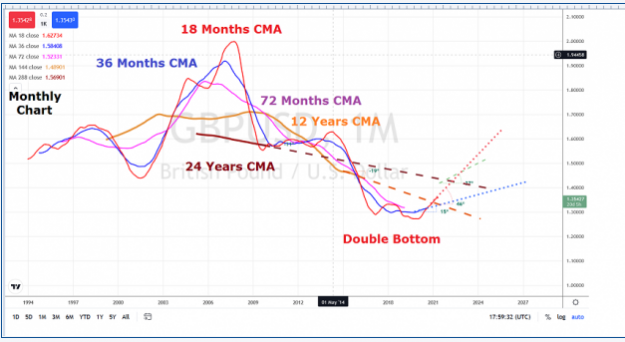
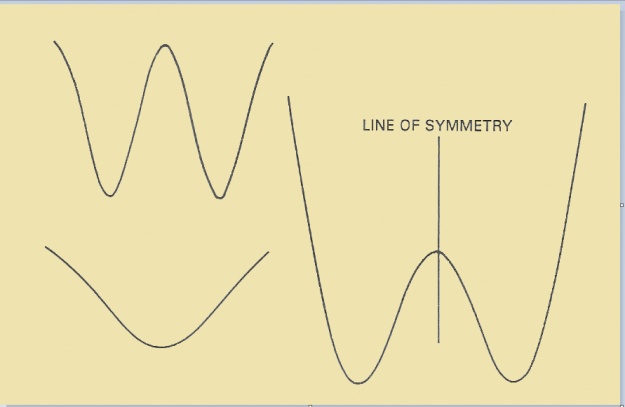
When there is a double bottom or a double top, you should consider that there might be a cycle changing direction half-way between those two points.
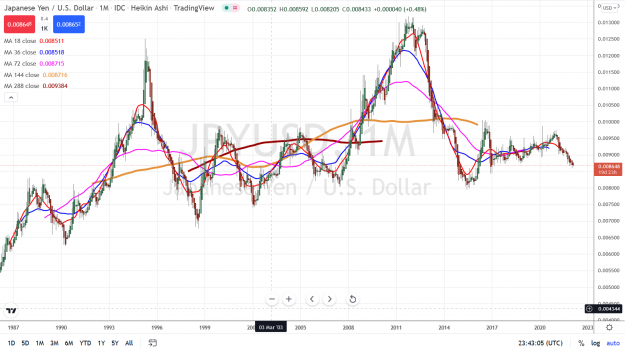
Chartists place a great deal of emphasis on patterns in stock price movement.
In general they look for the start of a recognizable pattern and then make the assumption that the probability is that it will complete its move in the previous way.
The patterns they look for include support and resistance lines, double tops, double bottoms, head and shoulders and inverse head and shoulders, triangles, flags and so on.
It is perfectly possible to explain each of these as being formed by a certain combination of cycles that are present in the stock movement at that particular time.
When there is a double bottom or a double top, you should consider that there might be a cycle changing direction half-way between those two points.
Chartists place a great deal of emphasis on patterns in stock price movement.
In general they look for the start of a recognizable pattern and then make the assumption that the probability is that it will complete its move in the previous way.
The patterns they look for include support and resistance lines, double tops, double bottoms, head and shoulders and inverse head and shoulders, triangles, flags and so on.
It is perfectly possible to explain each of these as being formed by a certain combination of cycles that are present in the stock movement at that particular time.
Attached Image(s) (click to enlarge)
3