This thread is opened to discuss the pro's and con's of the Envelopes Methodology based on the work of Jim Hurst and Brian Millard
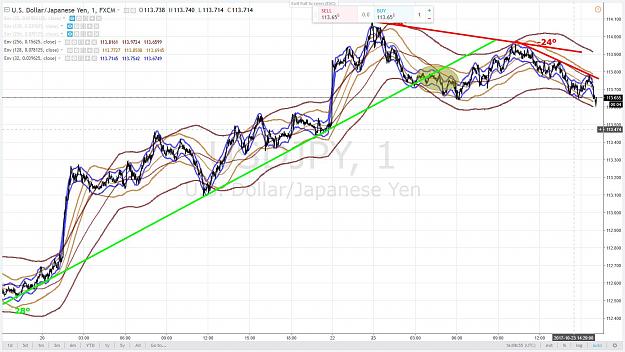
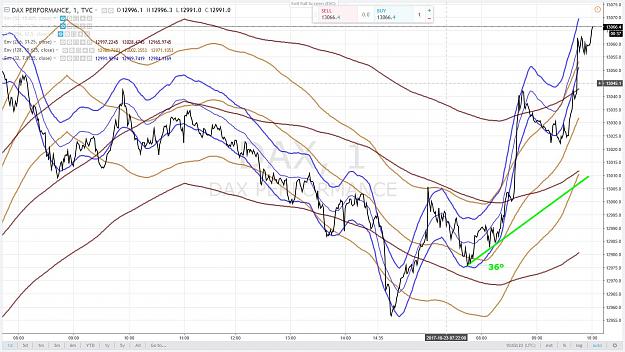
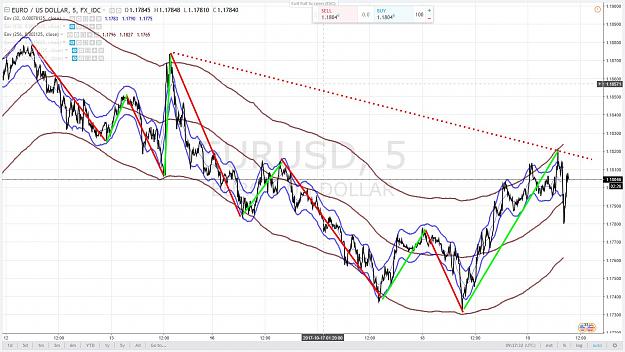
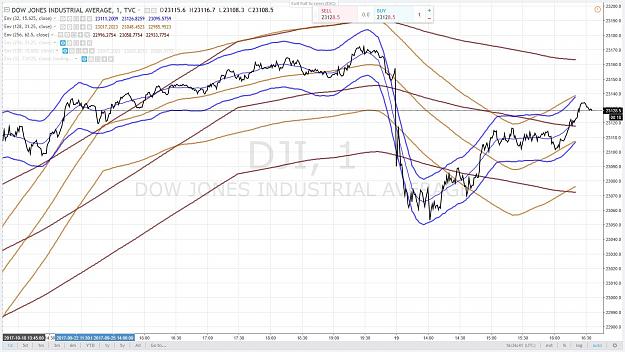
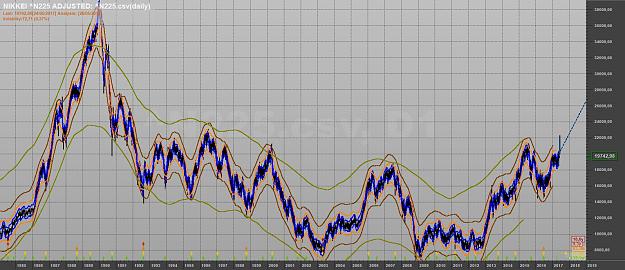
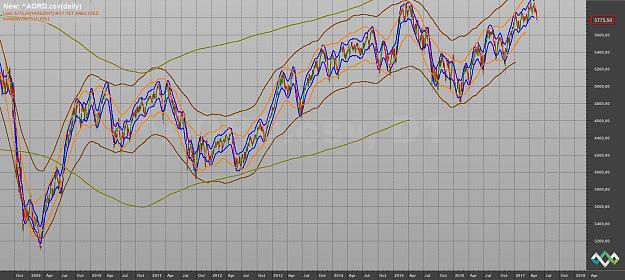
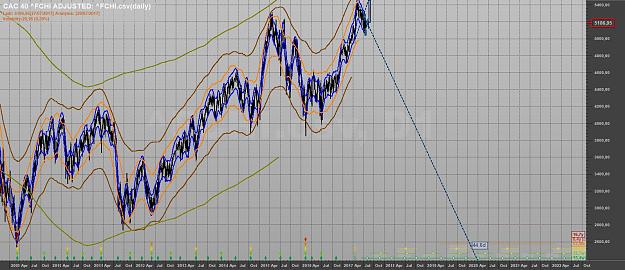
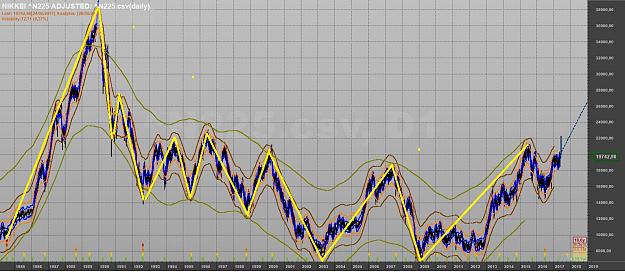
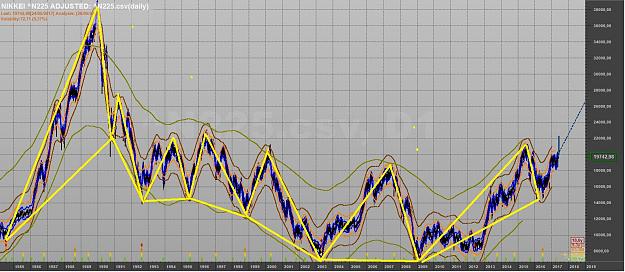
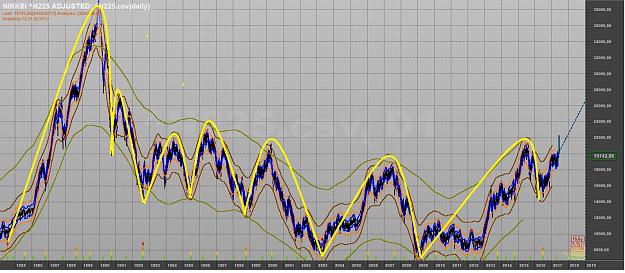
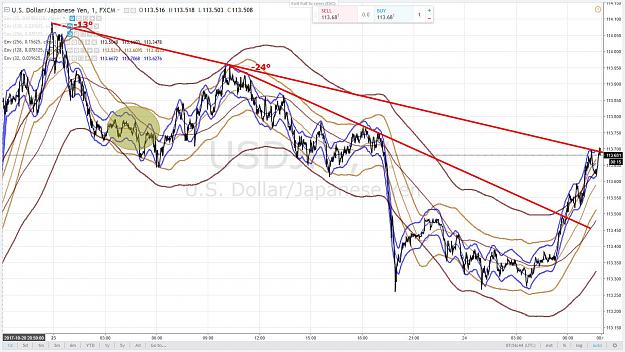
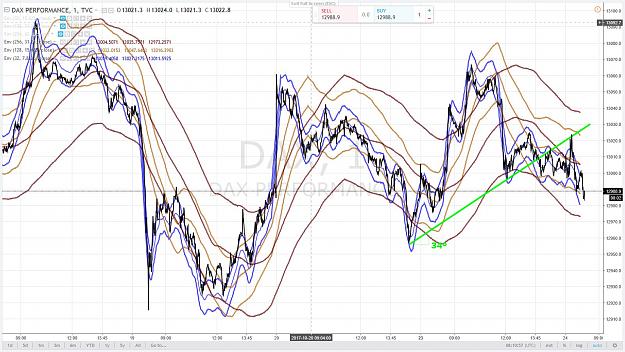
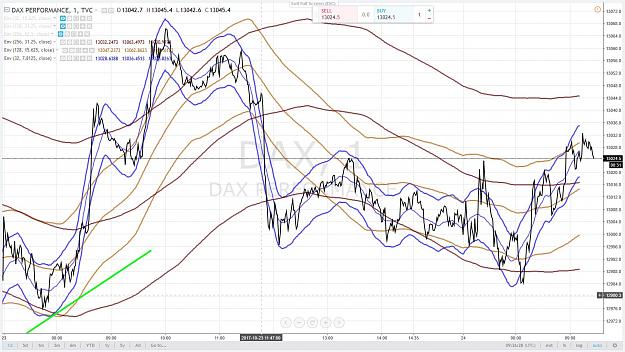
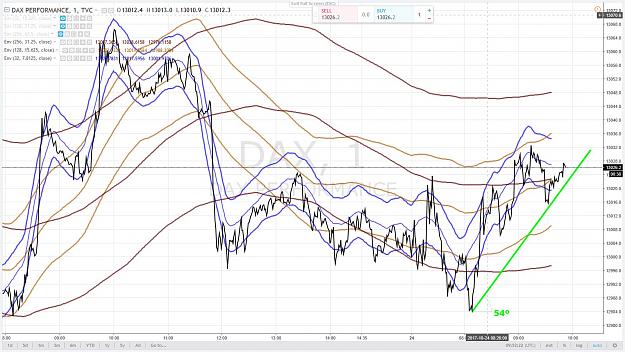
Hurst and Millard used Envelopes based on Centered Moving Averages and fixed width parameters
JM Hurst did extensive work with displaced moving averages (such as the well known half-span moving averages) and envelopes.
This channel is dedicated to discussion of this aspect of Hurst's work and approach.
Gann will help us to determine the right parameters (Law of Vibration)
Comments and questions are welcome
Others related subjects of interest as:
- Forks (Andrews, Tillman)
- Volume (Levine MIDAS Theory)
- Congestion Areas (Wyckoff)
- Envelopes
- Moving Averages
- Speed and Acceleration (Gann Angles)
will be adressed
Good readings
Important side note : I do not use MT4 - I have no EA available - I use TradingView:
For those among you who would use Envelopes "à la Hurst" on Tradingview, see here :
Courtesy of Terry Pascoe; You can thank him;
Terry gives us the possibility to calculate the Inverse Moving Average
https://www.tradingview.com/script/3...rse-Half-Span/
Envelopes indicators by Terry Pascoe (TradingView)
Morning Alain, this is a link to my current indicator.
MML indicator - : https://www.tradingview.com/script/A...th-Lines-Dark/
FLD indicator - https://www.tradingview.com/script/6c5lRGEg-FLDs/
Channels/CMAs indicator - https://www.tradingview.com/script/2...hannels-Alain/
Underlying cycles indicator - https://www.tradingview.com/script/k...erlying-Cycle/
Top Bottom Finder 'TBF) Courtesy of Terry Pascoe https://www.tradingview.com/script/G...Bottom-Finder/
Ajustable CMA Length (courtesy of Terry Pascoe) https://www.tradingview.com/script/v...le-cma-length/
Mc Clellan oscillator- https://www.tradingview.com/script/y...scillator-CMA/
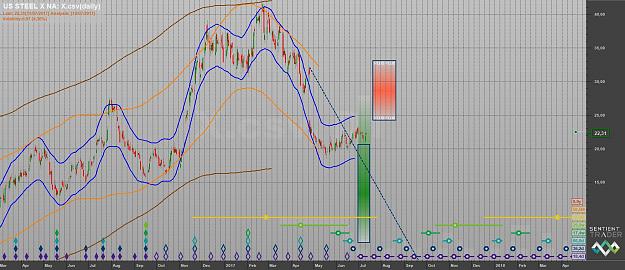
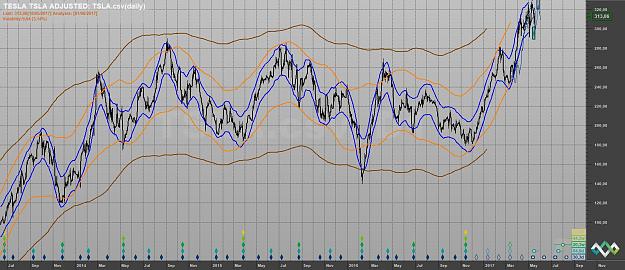
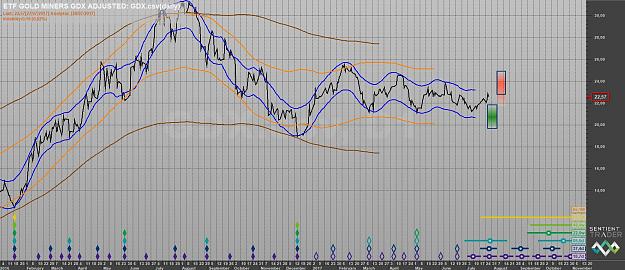
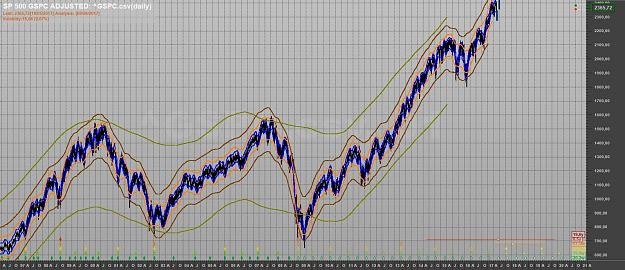
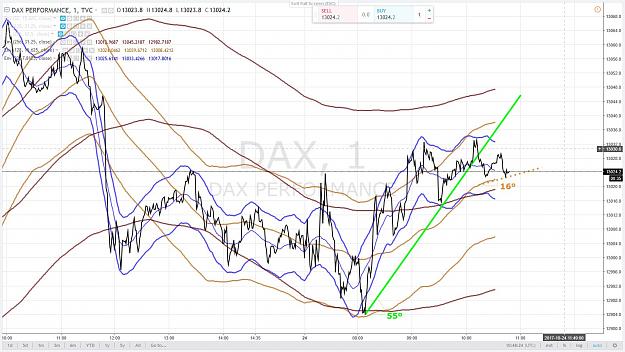
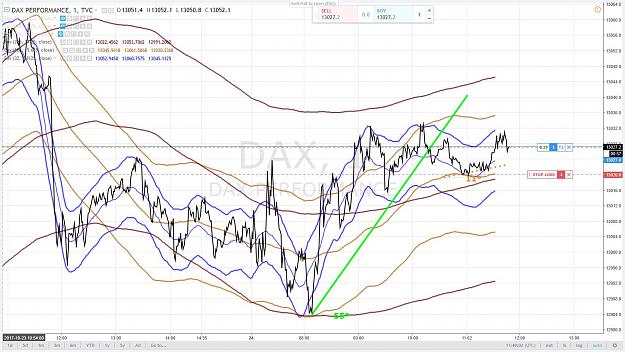
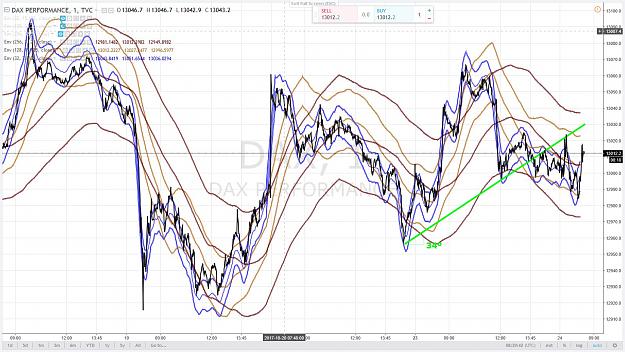
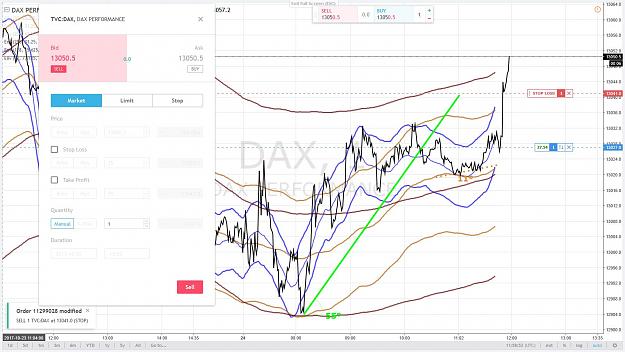
Attached File(s)