• Home
  • Forums
  • Trades
  • News
  • Calendar
  • Market
  • Brokers
  • Login
  • Join
  • User/Email: Password:
  • 9:26pm
Menu
  • Forums
  • Trades
  • News
  • Calendar
  • Market
  • Brokers
  • Login
  • Join
  • 9:26pm
Sister Sites
  • Metals Mine
  • Energy EXCH
  • Crypto Craft

Options

Bookmark Thread

First Page First Unread Last Page Last Post

Print Thread

Similar Threads

Analysis and Trading based on Envelopes, Waves, Cycles 8,535 replies

Forecast Forex using Numeric Cycles and Astrology Cycles 36 replies

Planetary cycles, astrological theory of cycles of the markets 495 replies

Planetary Cycles... Plotting Cycles into the Future 0 replies

Waves/Trends/Cycles 0 replies

  • Trading Discussion
  • /
  • Reply to Thread
  • Subscribe
  • 11
Attachments: Market Waves are NOT Cycles
Exit Attachments

Market Waves are NOT Cycles

  • Post #1
  • Quote
  • First Post: Edited at 12:44pm Jan 3, 2016 11:18am | Edited at 12:44pm
  •  mzvega
  • Joined May 2009 | Status: Member | 1,879 Posts
I just wanted to post a couple of articles & research on the topic of Market Waves & Cycles, from an Auction Market perspective.

Market Waves are NOT Cycles
Donald L. Jones
Copyright CISCO Futures March 25, 2005

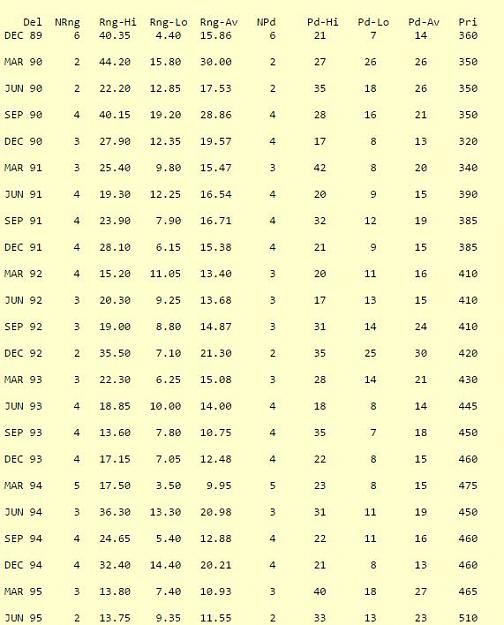
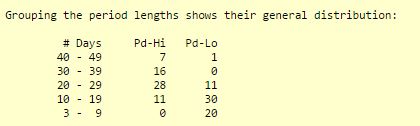
A hope of many technical analysts is that markets have a cyclic component that can be used for predictive purposes. Belief in an underlying periodicity is implicit in moving average smoothing, since the moving average is expected to act as a filter. The same is true of oscillators, where two moving averages of different time frames are subtracted to find differences. The fact that oscillator differences often move smoothly and change fast in highly directional markets is taken as evidence that the resulting curves provide information that can be traded. An underlying but unspoken assumption of virtually all technical analysis is that market data is well conditioned (small errors in the data produce small errors in the result). In fact, as will be shown below, the fundamental assumption of essentially equidistant peaks in a set of market data is incorrect, and thus market data is poorly conditioned for most of technical analysis.

It is theoretically true (Fourier analysis) that several waves of varying amplitudes and periods can be combined to provide a display that looks like market flow (with rises, falls and periods of low amplitude). Unfortunately, it is also true that market flow can and does come from a complex, self-regulating process (aggregate decisions of a large number of traders). This process cannot be described by any known mathematical distribution. Specifically ruled out is the fourier process, the market is not (so far as anyone can tell) a combination of sine waves.

Many elements of normal life are cyclic; the 24 hour day, seasons, weather, ice ages and other natural phemonena. Some economic phenomena such as booms and busts are thought to follow some sort of wave, such as the Kondratieff 30 to 60 year wave. In markets, much has been made of the Elliott five wave up and three wave down proposition. While phemonena such a Elliott waves become apparent after the fact, proponents seem unable to agree on the present. Even if you could tell which leg of an Elliott wave you are in, that knowledge would be hard to use in day-to-day trading where your outlook is rarely more than just a few minutes or days.

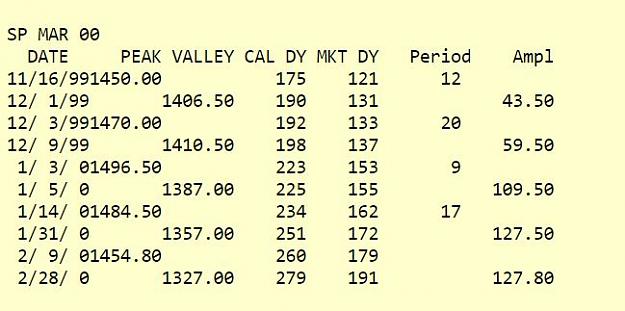
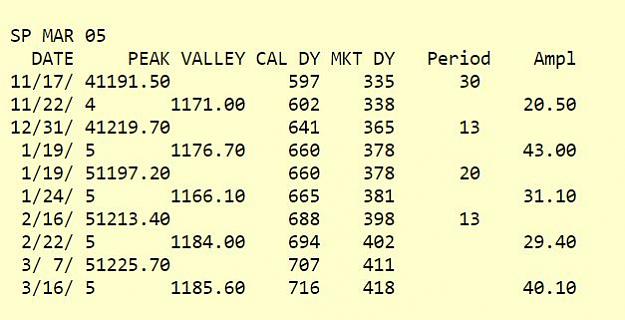
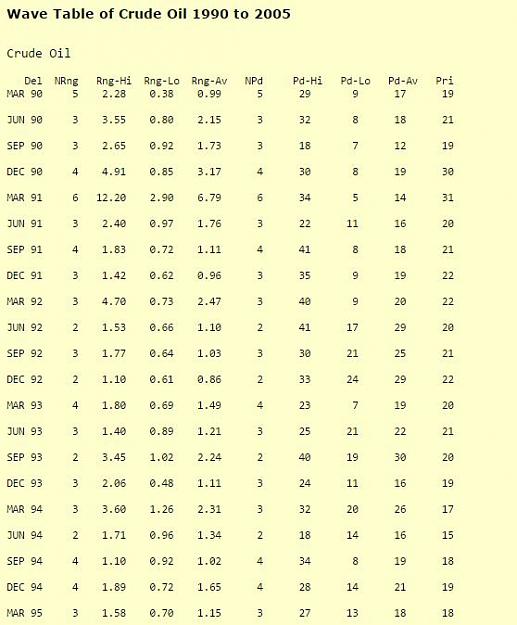
Markets always display wave-like motion. Prices move up and down with some regularity, describing local highs and lows. This movement reflects the changes in the way the composite of all traders, their feedback, value the market. While clearer on longer term charts, the local highs and lows describe periods that vary from wave to wave. Prediction of the next high or low cannot be made in any reliable way. Incidentally, prediction is not a requirement of successful trading

Because the source of market motion cannot be tied to any known distribution, a market surely cannot be described by a set of sine waves or helped in any real analytical sense by smoothing.
Markets are not efficient, rather they are effective - Jones
  • Post #2
  • Quote
  • Edited at 12:32pm Jan 3, 2016 11:25am | Edited at 12:32pm
  •  mzvega
  • Joined May 2009 | Status: Member | 1,879 Posts
Some analysts describe market waves as cycles, imputing a regularity not supported by the data itself. Analyzing market waves to obtain any predictability is not simple and may well be impossible, due to wave irregularity. Some waves can be very short, comprising just a day or two from top to bottom, others may take twenty days to find a bottom. While market waves for predicting the future seem to be impossible to divine, it is possible to look to the past to study the obvious wave motion in past data, with the aim of better understanding markets. We show in figure 1 below how widely the SP market has varied through the years. Figure 1 shows that the wave ranges of the SP have been decreasing since 2002 and helps explain why it is harder to trade the SP profitably today, as compared to the past.

We identify the historical wave motion with a 'seven day' rule--a peak is defined as the highest price reached since the previous low with no higher price within the past seven days. The low is generally defined the same way, but in cases of disagreement, say with a very short wave, the procedure is modified.

In the two short tables below, the SP futures of March 2000 and 2005 show a remarkable variability in period (time from peak to peak) and amplitude (range from peak to trough) is evident. The over-heated markets of 2000 had an average period of 14.5 days (with large variations) and an average amplitude of $25,000. The quieter time of 2005 displays a 25% longer period and an average amplitude 68% less.
Attached Image (click to enlarge)
Click to Enlarge

Name: figure 1.JPG
Size: 45 KB


Wave periods and amplitudes for the first quarter of 2000. This study at the height of the telecommunications bubble shows the cross market effect on the SP index in the wave amplitudes. A 100.0 range is $25,000. Wave times (periods) averaged 14.5 days. The average range per day is about $1,700; indicating much opportunity for the day trade
Attached Image (click to enlarge)
Click to Enlarge

Name: figure 2.JPG
Size: 46 KB


Wave periods and amplitudes for the first quarter of 2005. Five years after 2000, in a much cooler market, wave periods average 18.25 days and amplitudes are around 31 (approximately $8,000). Daily opportunity averages about $450. Clearly, from the standpoint of opportunity alone, it is harder to make money trading the SP in 2005.

In neither 2000 or 2005 are the periods of the waves stable. In both cases the variation is a factor of two or more over the approximately sixty days of the study.

The variation of the periods, more than 50%, illustrates how very poorly conditioned these data are for moving average operations, or in any other sort of filtering.
Markets are not efficient, rather they are effective - Jones
 
 
  • Post #3
  • Quote
  • Edited at 12:33pm Jan 3, 2016 11:28am | Edited at 12:33pm
  •  mzvega
  • Joined May 2009 | Status: Member | 1,879 Posts
Market Information Available
What can be learned from the two tables above?
1) As traders, we might guess that there was much more opportunity for the day trader in 2000 than 2005. It is clear that market opportunity can show large changes over time.

2) The time-frame variations of the waves in these two three-month periods are such that it is unlikely that standard moving averages or oscillators can be trusted.

3) Amplitudes of the waves, if longer time-frames are examined (tables below), might measure the relative opportunity at various times. It is an observed fact that all markets pass through periods of good tradeability and periods of sluggishness. A trader finds it very difficult to trade profitably if a market is offering little opportunity.

4) We know that (theoretically, at least) it may be possible to locate those markets offering opportunity at a given time. In fact, our job is to ferret out those markets with large opportunity.

5) Simply knowing the irregular structure of the market will lead us to disbelieve the stories told by model salesmen. More to the point, such knowledge will lead us to search analytical methodologies that work within the actual, complex market, analysis.
Markets are not efficient, rather they are effective - Jones
 
 
  • Post #4
  • Quote
  • Jan 3, 2016 11:38am Jan 3, 2016 11:38am
  •  mzvega
  • Joined May 2009 | Status: Member | 1,879 Posts
Graphic of SP Wave Amplitudes, 1990 - 2005
In figure 1 below we examine the wave amplitudes for nearly fifteen years of the SP market (emini SP, of course, has the same amplitudes but only one-fifth of the dollar range). Large wave amplitudes are trader friendly because they indicate opportunity. We note that SP went from a quiet, rather dull market (early to mid 1990's), to an extremely active, large amplitude period (1995 to 2002). Now it is cooling down.

Attached Image (click to enlarge)
Click to Enlarge

Name: fig.1.JPG
Size: 32 KB


Figure 1. Average trading wave amplitude for SP. Quarterly averages (four per year), provide the average trading opportunity (price range from high to low in a wave). Wave peaks are the highest prices within the previous 7 trading days. The average number of days in a wave, calculated quarterly (not shown on this graphic) varies from a low of 11 (second quarter of 1998) to a high of 43 (fourth quarter of 1998). Wave amplitudes (price range from high to low in a wave, averaged per quarter) were as small as 11.2 (4th Qtr 1993 and 1st Qtr 1995) and as large as 155.5 ($38,875) )(4th Qtr 2000). Ranges above 100 are truncated on this graph.
Markets are not efficient, rather they are effective - Jones
 
 
  • Post #5
  • Quote
  • Edited at 12:50pm Jan 3, 2016 11:53am | Edited at 12:50pm
  •  mzvega
  • Joined May 2009 | Status: Member | 1,879 Posts
Wave Table of SP 1990 to 2005
The tabular data for figure 1 provides more detail on the wide, diverse variation in wave highs and lows as well as the number of days in periods. The 'bubble' of 1998, 1999, 2000, 2001 and 2002 shows exceptional variation. Markets are most tradeable if the waves have large amplitude and long wave periods. Large ranges mean that whatever your strategy, you can get aboard at a variety of prices. Your timing does not have to be perfect. Likewise, if the wave period is longer, again your timing constraints are relaxed.

Each market behaves differently, but relative to itself it is easy to use a graphic like figure 1 or the table below, to sort out the good places to trade. Figure 1 shows that the best times started to wane in 2002. Roughly, we believe that wave amplitudes below about 40 ($10,000 for SP, $2,000 for emini) herald more difficult trading. Below about 25 ($6,250 for SP, $1,250 for emini) a trader is well advised to bring other markets, ones with more opportunity, into the trading mix. SP/emini will still offer cases of exceptional potential, but more rarely. Even in the duller periods SP offers some big opportunities, but that may not be enough to keep a day-trader going.

In contrast to the SP, crude oil spends long periods doing little, then a great amount of activity. Crude will be briefly discussed after the SP.
Attached Image (click to enlarge)
Click to Enlarge

Name: sp wave table.JPG
Size: 64 KB

Attached File
File Type: docx Wave Table of SP 1990 to 2005.docx   13 KB | 275 downloads


Headings:
Del = delivery
NRng = number of waves per quarter
Rng-Hi = the largest high-low range per quarter
Rng-Lo = is the smallest high-low range per quarter
Rng-Av = average high-low range
NPd = the number of waves in a calculation
Pd-Hi = the largest number of days in a wave
Pd-Lo = the least number of days in a wave
Pd-Av = the arithmetic average number of days in a wave.
Pri = approximate average price for the quarter

Grouping the period lengths shows their general distribution:

Attached Image


Historically, from the time of Welles Wilder's book on technical analysis in 1978, the choice for averaging was fourteen days. For the low periods, that falls in about the middle. However, the median for the high periods is about ten days more or around twenty five days. Again, there is not even a vestige of a median to average around. The consequence is that averaging, as in moving averages and oscillators, is close to dealing with random numbers.

Both the price range and number of days in a wave are highly variable. The days in the average wave tend to be less in the low opportunity regions.

The rough plot of the quarterly average wave amplitudes (figure 1, above), gives one a feel for the wave fluctuations. From 1997 through 2002 the wave amplitudes were extraordinarily high. Lately (2005), the amplitudes seem to be regressing toward the earlier values. First quarter of 2005 at amplitude of 40 is 1/2 to 1/4 the preceeding values of several years. Thus, there is now less opportunity.

SP is not alone in showing long term variations in opportunity. All markets pass through periods of high demand and then regress back to normality. Since the SP, and its small brother the emini, have been the most actively traded markets we have ever seen; traders who began trading in the late 1990's are finding profits more elusive. They may find it advisable to diversify into other markets.
Markets are not efficient, rather they are effective - Jones
 
 
  • Post #6
  • Quote
  • Jan 3, 2016 12:13pm Jan 3, 2016 12:13pm
  •  mzvega
  • Joined May 2009 | Status: Member | 1,879 Posts
Crude Oil
We noted above that a long term view of the waves of a market can orient a trader with it's perspective. Whereas SP appears to be fading as a primary market for day-trading, crude seems to be coming to the fore. Lengths of the waves are steady but amplitudes are generally extending since 2000. Crude is becoming a better market to trade. This observation is supported by the frequency of energy appearances in the Select Tables:

Attached Image (click to enlarge)
Click to Enlarge

Name: crude.JPG
Size: 61 KB

Attached File
File Type: docx Wave Table of Crude Oil 1990 to 2005.docx   13 KB | 285 downloads


Headings:
Del = delivery
NRng = number of waves per quarter
Rng-Hi = the largest high-low range per quarter
Rng-Lo = is the smallest high-low range per quarter
Rng-Av = average high-low range
NPd = the number of waves in a calculation
Pd-Hi = the largest number of days in a wave
Pd-Lo = the least number of days in a wave
Pd-Av = the arithmetic average number of days in a wave.
Pri = estimated average price for the quarter


The timeframe MAR 90 through Jun 00 is one of low opportunity and low trading opportunity (a range of 1.0 is $1000). Average wave length for this period is 22 days. From Sep 00 through the present, average wave amplitudes are about double of the earlier ones. Average wave length for the later period is 22 days, same as for the low amplitude region. What the market is doing, is simply offering more opportunity in the same elapsed time.

A chart of the annualized opportunity tends to confirm the findings of the wave table, although the dip in opportunity later in 2003 is much sharper. The rebound in 2004 is clear on both representations. The data is specifically designed to find trading opportunity, while the waves are more general.

Attached Image
Markets are not efficient, rather they are effective - Jones
 
 
  • Post #7
  • Quote
  • Jan 3, 2016 12:15pm Jan 3, 2016 12:15pm
  •  mzvega
  • Joined May 2009 | Status: Member | 1,879 Posts
Most traders rely on forms of technical analysis for their trading. When the market is accomodating by offering a lot of opportunity, many sorts of analyses work. In the stock market it is well known that all stock pickers are smart in bull markets. In futures where a trader can do as well in a big bear market as in a bull, the key is opportunity. A market that is shutting down (congesting) displays smaller trading ranges and even these take longer to develop. The trader is advised to constantly seek opportunity. It can be done. Anyone can keep track of the waves, simply from the daily high - low price data.
Markets are not efficient, rather they are effective - Jones
 
 
  • Post #8
  • Quote
  • Jan 3, 2016 2:28pm Jan 3, 2016 2:28pm
  •  mzvega
  • Joined May 2009 | Status: Member | 1,879 Posts
The Market Unit (tm)
By Donald L. Jones, March 17, 2005
Copyright 2005

Foreword
Auction market analysis is based on value. Day value is from Market Profile/ Meta-Profile and longer term value comes from the Overlay Demand Curve. (Market Profile is from a CBOT Liquidity Data Bank, Meta-Profile is from tick data.) Constant value defines a market in balance. Changing value (trend) starts from balance, runs directionally, stops changing and ultimately ends back in a balance. The process of balance-to-trend and back to balance is a Market Unit. The elapsed time of a market unit varies from unit to unit. A series of market units forms a new, deeply revealing sort of market data. A market in balance offers traders quantitative knowledge of their market. Balance limits (upper and lower), center of value and price range are all parameters highly useful in a trade set-up.

We begin by a simple examination of the structure of markets in general. Markets move in waves, from high to low and low to high etc., continuously. The time to complete a wave varies from wave to wave. One cycle might be 10 days and the next can be 30 days in a completely irregular manner. Likewise, the amplitude from top to bottom of a wave varies widely. For instance from April 7 to September 2003 for the SP there were 5 complete waves. The number of days per wave varied from 13 days to 28 days. An example of wave dates and their amplitude illustrates the irregularity.

Attached Image

In this short run (under six months), wave periods varied by over a factor of two. In the earlier months of 2003 the variation in period was a factor of three. Such variations are found in all markets. We conclude that markets show little regularity. A consequence is that 'smoothing', as with moving averages, is on a slippery slope indeed since there is no general smoothing value (e.g. the 14 days in Wilder's book on technical analysis). These results play a major role in the general ineffectiveness of technical analysis based on moving averages and oscillators. However, we are primarily interested in the support lent to the market unit studies by this look at market variability. Market unit analyses flesh out our bare-bones study of market waves.
Markets are not efficient, rather they are effective - Jones
 
 
  • Post #9
  • Quote
  • Last Post: Mar 24, 2018 7:07am Mar 24, 2018 7:07am
  •  parisboy
  • Joined Oct 2017 | Status: Member | 7,731 Posts
Quoting mzvega
Disliked
Most traders rely on forms of technical analysis for their trading. When the market is accomodating by offering a lot of opportunity, many sorts of analyses work. In the stock market it is well known that all stock pickers are smart in bull markets. In futures where a trader can do as well in a big bear market as in a bull, the key is opportunity. A market that is shutting down (congesting) displays smaller trading ranges and even these take longer to develop. The trader is advised to constantly seek opportunity. It can be done. Anyone can keep...
Ignored

for your information
Attached File
File Type: pdf James Bickford - Forex Wave Theory, A Technical Analysis for Spot and Futures Curency Traders.pdf   5.9 MB | 12,275 downloads
 
 
  • Trading Discussion
  • /
  • Market Waves are NOT Cycles
  • Reply to Thread
0 traders viewing now
Top of Page
  • Facebook
  • Twitter
About FF
  • Mission
  • Products
  • User Guide
  • Media Kit
  • Blog
  • Contact
FF Products
  • Forums
  • Trades
  • Calendar
  • News
  • Market
  • Brokers
  • Trade Explorer
FF Website
  • Homepage
  • Search
  • Members
  • Report a Bug
Follow FF
  • Facebook
  • Twitter

FF Sister Sites:

  • Metals Mine
  • Energy EXCH
  • Crypto Craft

Forex Factory® is a brand of Fair Economy, Inc.

Terms of Service / ©2022