“Centered moving averages,” which are a twist on the more traditional moving averages, are your mainstay and correlate with your cycle periods. How are they constructed?
First of all, you create moving averages of the stock or index prices that you want to analyze.
Choose a moving average that is one-half of the cycle period that you want to observe.
If you are looking at a four year cycle, you would use a two year moving average.
A two year moving average will track a four year cycle. Then you place the two year moving average 1/2 span back on your charts, in other words, you lag it one year on your charts.
If you are looking at a 20 week cycle, you would use a 10 week moving average and place that average five weeks back on the chart.
Every moving average that I use is one-half the length of the cycle and displaced one-half span.
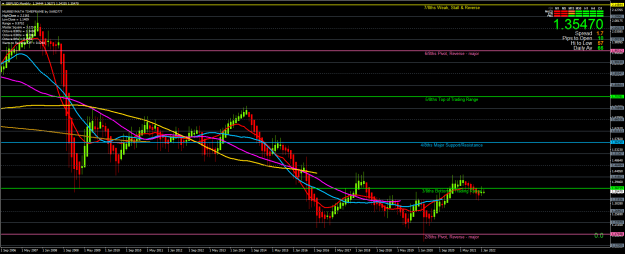
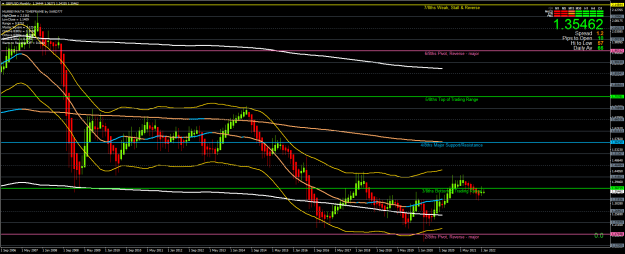
I think I'm getting the hang of it. (Or it was just luck lol!) {image} I made the FLDs by the moving average of 1 and shifting them 8, 16, 32 forward. Is that the correct way? We could say the target has been reached, right?
Additional clues “Centered moving averages,” which are a twist on the more traditional moving averages, are your mainstay and correlate with your cycle periods. How are they constructed? First of all, you create moving averages of the stock or index prices that you want to analyze. Choose a moving average that is one-half of the cycle period that you want to observe. If you are looking at a four year cycle, you would use a two year moving average. A two year moving average will track a four year cycle. Then you place the two year moving average...
Ignored
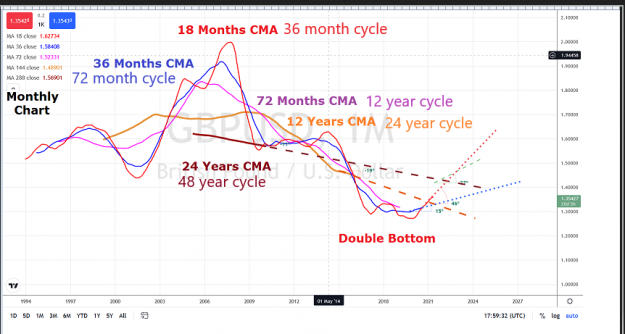
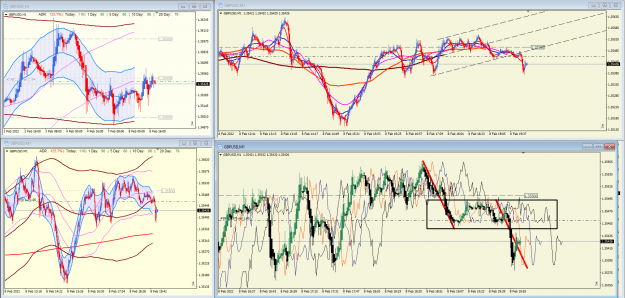
So that's how the displacement and shifting to the back half of the moving average period is. Got it!
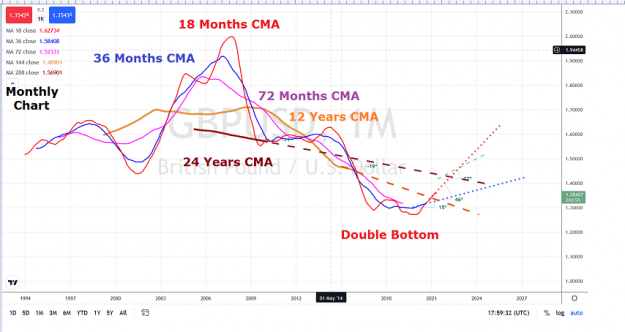
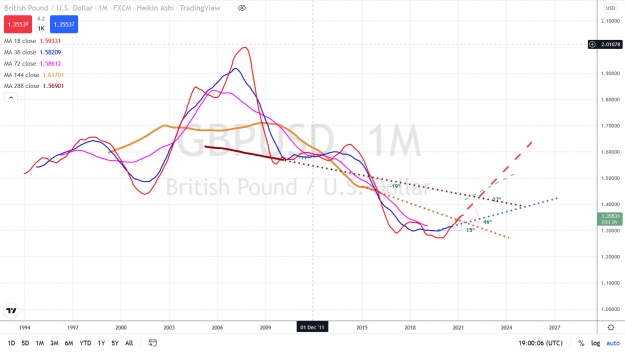
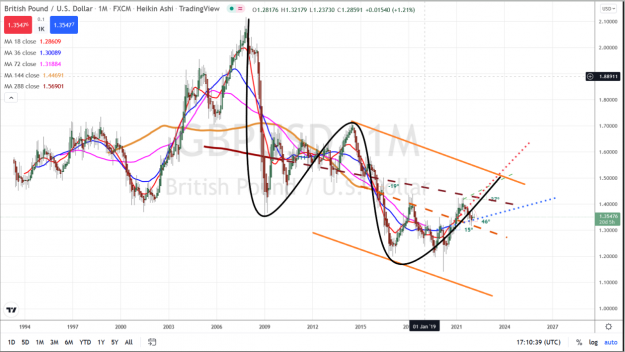
So now looking at this chart, these would be the cycles each CMA is showing us, right?
{quote} So that's how the displacement and shifting to the back half of the moving average period is. Got it! So now looking at this chart, these would be the cycles each CMA is showing us, right? {image}
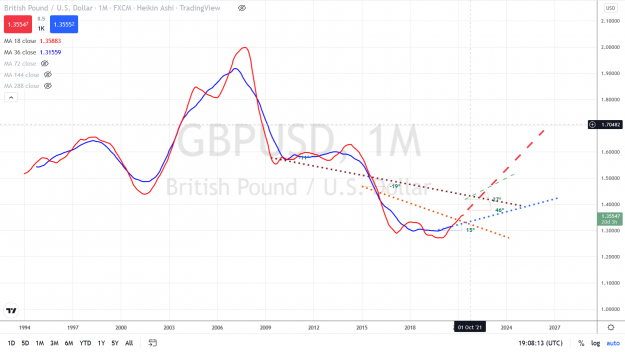
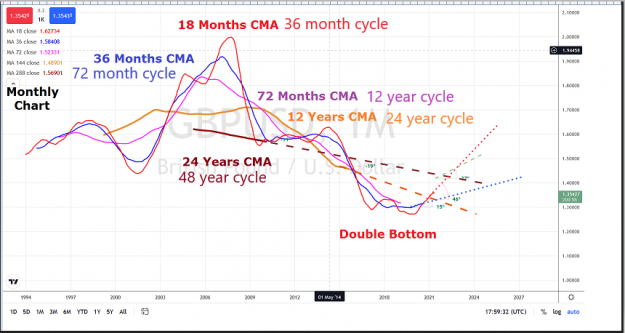
{quote} Excellent observation. More Precisely which Cycles ? {image}
Ignored
PB I'm not sure I understand your question.. But if I had to say what I've understood is that each cycle oscillates around its CMA (which is half its span)
So if I stand corrected, in this pic the two shorter term cycles (red and blue)(36 month cycle and 72 month cycle) are pointing up, and the other two longer term (brown and ocre) are pointing down.
Which one can conclude that before those upward pointing cycles are over, trend is up. After that, the longer term cycles come in to play and we go into a downtrend. Is it correct to assume this way?
I don't know if I'm overanalyzing these or not : ))
{quote} PB I'm not sure I understand your question.. But if I had to say what I've understood is that each cycle oscillates around its CMA (which is half its span) So if I stand corrected, in this pic the two shorter term cycles (red and blue)(36 month cycle and 72 month cycle) are pointing up, and the other two longer term (brown and ocre) are pointing down. Which one can conclude that before those upward pointing cycles are over, trend is up. After that, the longer term cycles come in to play and we go into a downtrend. Is it correct to...
Ignored
It is a good reasoning, but you have another option. Which one ?