• Home
  • Forums
  • Trades
  • News
  • Calendar
  • Market
  • Brokers
  • Login
  • Join
  • User/Email: Password:
  • 7:37am
Menu
  • Forums
  • Trades
  • News
  • Calendar
  • Market
  • Brokers
  • Login
  • Join
  • 7:37am
Sister Sites
  • Metals Mine
  • Energy EXCH
  • Crypto Craft

Options

Bookmark Thread

First Page First Unread Last Page Last Post

Print Thread

Similar Threads

What is A book vs B book in Forex trading? 30 replies

A book forex brokers VS B book brokers, differences? 12 replies

Traders' Book Club 10 replies

The Book Club 5 replies

  • Trading Discussion
  • /
  • Reply to Thread
  • Subscribe
  • 914
Attachments: The Finance Book Club
Exit Attachments

The Finance Book Club

  • Last Post
  •  
  • 1 3031Page 323334 42
  • 1 31Page 3233 42
  •  
  • Post #621
  • Quote
  • Nov 23, 2021 10:05pm Nov 23, 2021 10:05pm
  •  clemmo17
  • Joined Jul 2016 | Status: Member | 1,600 Posts
Trading With Ichimoku Clouds : The Essential Guide to Ichimoko Kinko Hyo Technical Analysis by Manesh Patel

Yes, it’s yet another TA book, but in my defence, this one is a bit different. Actually very different as it doesn’t focus on a complex tapestry of different indicators working together to produce a confused mess - it’s all about one indicator (which itself may be a complex collection of messy ideas) so maybe it will make more sense, and maybe not. Let’s find out!

Introduction

  1. Ichimoku Kinko Hyo - a system used in Japan for years but hasn’t gained widespread adoption in the west like candles have, largely thanks to Steve Nison.
  2. Patel, (MP from now on) blames technology for the volatility in the market at the time of writing
  3. MP is an engineer and used to overcomplicate things ‘as engineers tend to do’ (do they?)
  4. Patel believes many companies are falsifying their earnings with creative accounting
  5. He makes the tired (and terrible) analogy of trading as a hunt for prey


Attached Image (click to enlarge)
Click to Enlarge

Name: pasted image 0.png
Size: 97 KB

  1. Without a plan you are simply doing trial and error
  2. The plan must suit your personality

Attached Image (click to enlarge)
Click to Enlarge

Name: pasted image 0 (1).png
Size: 76 KB

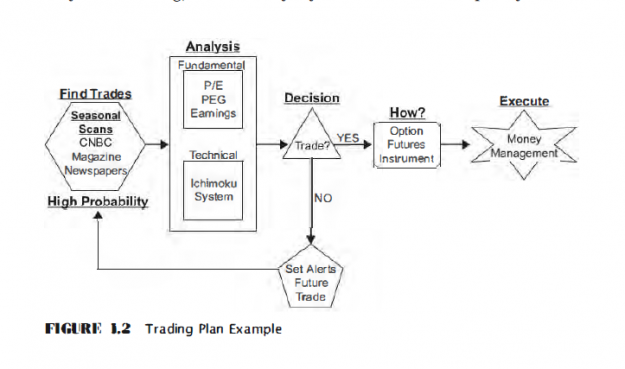
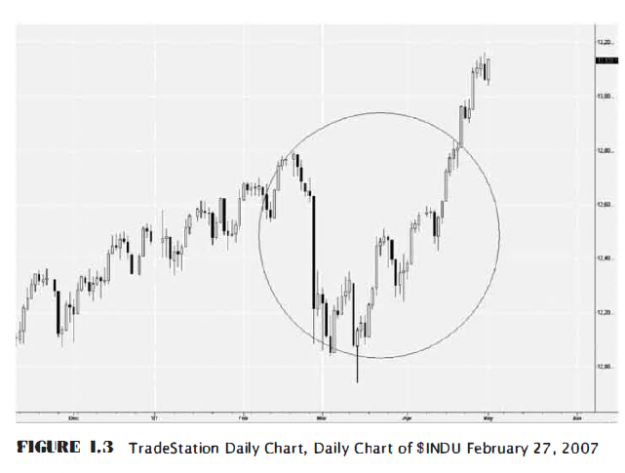
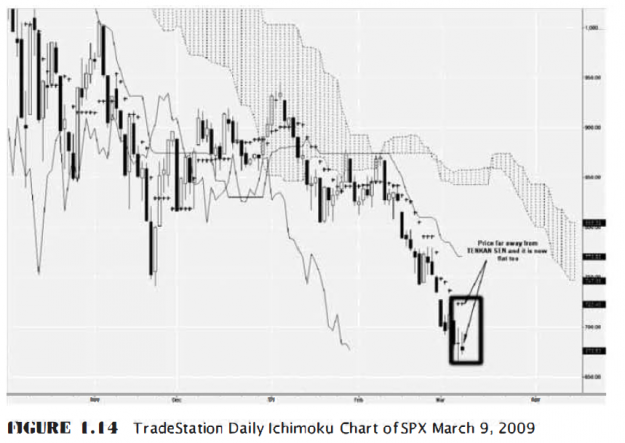
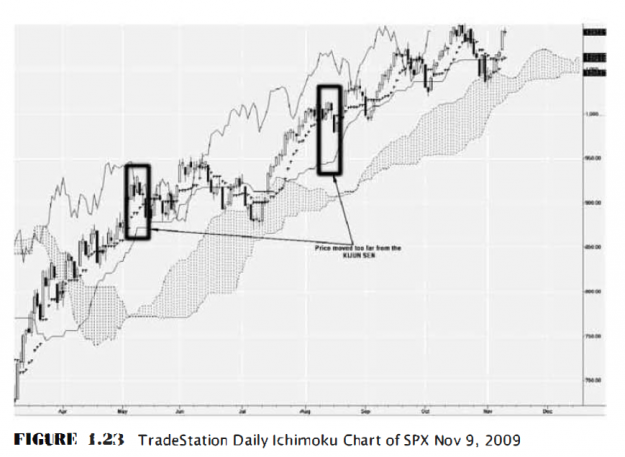
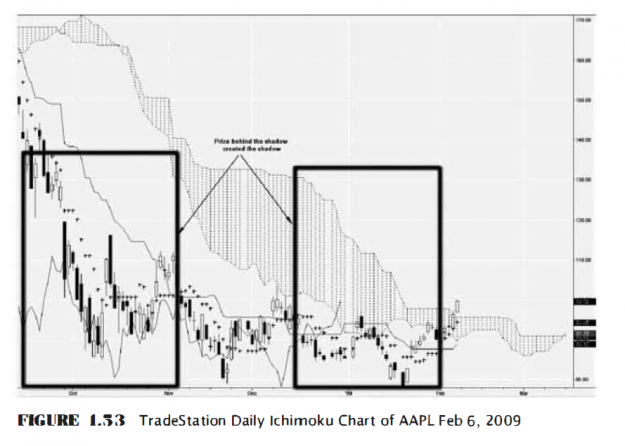
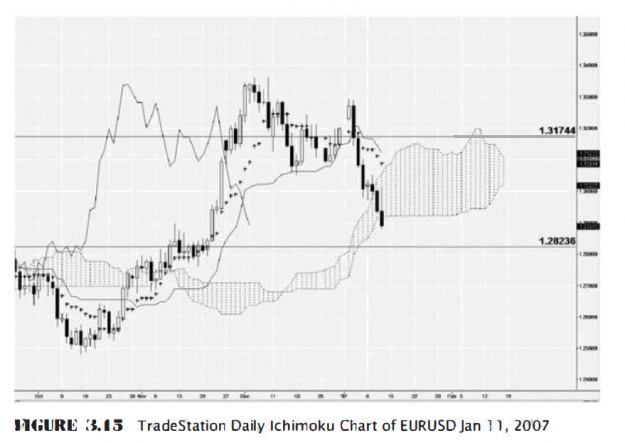
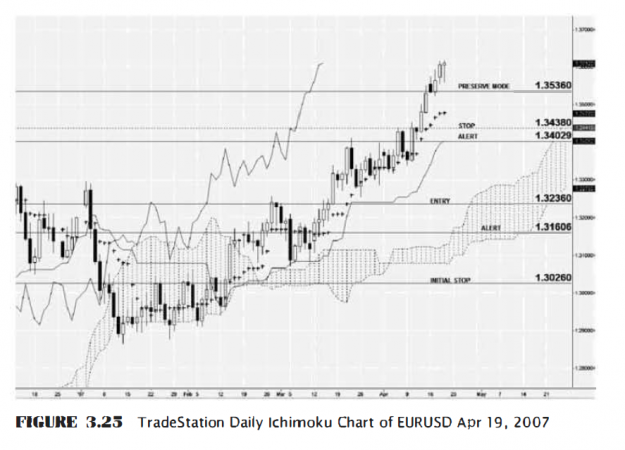
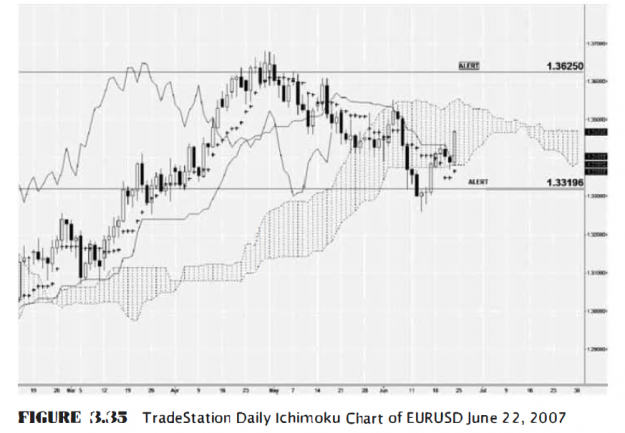
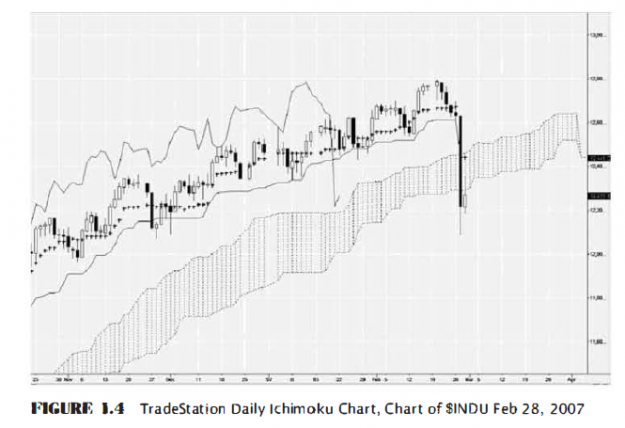
MP shows us this chart and claims Ichimoku would have got us out 1-2 days before the drop.

Attached Image (click to enlarge)
Click to Enlarge

Name: pasted image 0 (2).png
Size: 138 KB

  1. MP outlines a trading plan very similar to all the other ones we’ve seen

    1. What instruments?
    2. What time frame?
    3. Entry rules
    4. Fundamental PEG, PE, Cash flow
    5. Technical: Ichimoku, MA, ATR, Fib, Gann, Pivots, VSA
    6. Money Management: use stops
    7. Set profit target
    8. Size positions
    9. Time entry/exit
    10. Risk per trade
    11. Risk per month
    12. R:R
    13. Post-trade analysis


  2. MP claims the word ‘stop loss’ is scary because of the word ‘loss’
  3. “The most valuable aspect of Ichimoku Kinko Hyo is that it looks for history to repeat itself now and also in the future. Through the Ichimoku charts, you can see past "events" easily and make current decisions based on past events.”
  4. MP calls Gann ‘one of the most successful traders of all time’ which is highly suspect

History

  1. Goichi Hasada revealed Ichimoku Kinko Hyu (IKH from now on) in 1948 to Hidenobu Sasaki (notice that it’s always a guru revealing his secrets to a pupil who is also an author)
  2. We can learn more about the history in a book by Nichole Elliott says MP
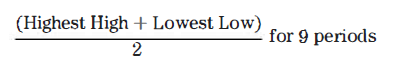
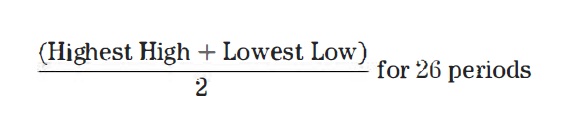
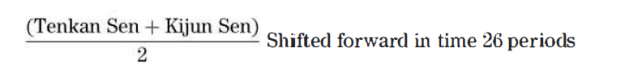
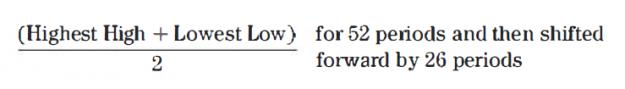
  3. IKH is made up of 5 components

 
1
  • Post #622
  • Quote
  • Nov 24, 2021 10:32am Nov 24, 2021 10:32am
  •  clemmo17
  • Joined Jul 2016 | Status: Member | 1,600 Posts
Chapter 1 - Ichimoku Components

  1. MP uses the daily TF but it works on any TF
  2. If you use multi-TF analysis you can get confused (true)

IKH has 5 components

  1. Tenkan Sen (red)
  2. Kijun Sen (green)
  3. Chikou Span (light purple)
  4. Senkou A (dark blue)
  5. Senkou B (dark purple)


One issue is the charts in this book are all grayscale. MP says that he has colour-coded charts on his website, but when I go there it gets redirected to a different site that is only tangentially about Ichimoku or MP at all, as far as I can tell. Just another string of book website disappointments.

The five components working together tell the ‘story’ of the chart instrument

Tenkan Sen

  1. Represents the short term movement for price
  2. Red
  3. Formula is

Attached Image


  1. Tenkan Sen takes into consideration intraday volatility by using high and low prices instead of just close prices like an MA

Attached Image (click to enlarge)
Click to Enlarge

Name: pasted image 0.png
Size: 107 KB

We are supposed to be able to see that the TS only rose above the intraday low once where a 9 period SMA does many times. I actually don’t know which section he considers ‘the trend’ because it seems to me both lines rise above the intraday low a few times.


  1. You can use it as a stop level
  2. Why 9 periods instead of 10? MP says it’s tradition as Japan had 9 trading days in a period.
  3. MP is not interested in messing with tradition. He rightly points out that if you messed with the settings of all the component indicators it would produce thousands of combinations.
  4. Tenkan Sen indicates sentiment, with price bullish above it and bearish below it, and it should be pointing in the same direction as the trend
  5. When it is flat it indicates possible consolidation
  6. TS is a short-term resistance/support value, so when price crosses it that’s a ‘major accomplishment’
  7. In a trend if price crosses the TS in the opposite direction this could indicate:

    1. Minor short-term pullback - if it crosses TS but doesn’t cross Kijun Sen (KS)

      1. Short-term traders taking profits

    2. Major short-term pullback - crosses both TS and KS in the opposite direction

      1. Long-term traders taking some profits but not leaving the market

    3. Countertrend - same as major short-term pullback but the trend never resumes - it either consolidates or reverses trend

      1. Long-term traders exit completely

  8. TS should be close to price; if price escapes from the TS then there is high chance of a pullback

Attached Image (click to enlarge)
Click to Enlarge

Name: pasted image 0 (1).png
Size: 218 KB

Price has moved too far from TS
 
1
  • Post #623
  • Quote
  • Nov 24, 2021 11:16am Nov 24, 2021 11:16am
  •  clemmo17
  • Joined Jul 2016 | Status: Member | 1,600 Posts
Kijun Sen

  1. Represents medium term movement - caters to the majority
  2. Green (in MT4 it’s blue by default. I’m going to change it to match MP

Attached Image

  1. Similar to a 30 period SMA that ‘most institutional and retail traders use”
  2. Sentiment - same as TS
  3. Trend - same as TS
  4. A minimum of 26 days of trend must be established before the KS will react as needed so we will always miss the beginning of a trend; this avoids risk
  5. If KS is flat price is consolidating
  6. KS is major support/resistance also
  7. A trend change ‘may’ occur if price crosses it; no major pullback or reversal can happen until price does cross it
  8. Pullback scenarios - same as TS
  9. KS should also be close to price
  10. To his credit MP asks what ‘far’ means when we ask if price is too far from the TS or KS? However he uses an unsatisfyingly vague definition. Look at past price and see how far too far was ‘before’. The distance changes with volatility.

Attached Image (click to enlarge)
Click to Enlarge

Name: pasted image 0 (1).png
Size: 219 KB

Periods where price was too far, and sure enough price reverted back to the lines.

MP says some traders would use a multiple of ATR like 1.5x or 2x (I would).

MP tells a silly story about a child walking with his parents, trying to illustrate the fact that sometimes price will run ahead of the lines and sometimes price will slow down to allow it to catch up. It doesn’t do anything to explain the ‘relationship’ between these mystical lines and price.
 
1
  • Post #624
  • Quote
  • Nov 24, 2021 11:18am Nov 24, 2021 11:18am
  •  clemmo17
  • Joined Jul 2016 | Status: Member | 1,600 Posts
Chikou Span

  1. Represents the momentum of price
  2. Tells you if a trend can occur or not occur
  3. Chikou span is current price shifted backwards 26 periods
  4. Purple
  5. Bullish sentiment if CS is above price from 26 periods ago or bearish if it is below

Attached Image (click to enlarge)
Click to Enlarge

Name: pasted image 0.png
Size: 206 KB

This is bullish. As if I need a magic line to tell me that.

Price is consolidating if CS gets tangled up in price or is about to.
If it is in open space then the trend action is strong.
Attached Image (click to enlarge)
Click to Enlarge

Name: pasted image 0 (1).png
Size: 233 KB

Strong trend

  1. The peaks/troughs of the CS are major support/resistance

 
1
  • Post #625
  • Quote
  • Nov 24, 2021 11:21am Nov 24, 2021 11:21am
  •  clemmo17
  • Joined Jul 2016 | Status: Member | 1,600 Posts
Kumo Cloud components

  1. Senkou Span A

    1. Dark Blue

Attached Image (click to enlarge)
Click to Enlarge

Name: pasted image 0.png
Size: 22 KB

  1. Senkou Span B

    1. Purple

Attached Image (click to enlarge)
Click to Enlarge

Name: pasted image 0 (1).png
Size: 19 KB

  1. The cloud is formed by filling the space with colour between the two lines, where red is bearish and yellow is bullish
  2. If A > B then the colour is bullish
  3. If B > A then the colour is bearish
  4. Confusing because there are really 2 clouds - the past and the future
  5. Current price movement affects the future
  6. The current values are in the future, the values in the past are 26 or 52 periods old
  7. Sentiment

    1. Bullish when price is above the cloud
    2. Bearish when below the cloud
    3. Consolidating when inside the cloud

  8. Future sentiment

    1. Bullish when SenkouA > Senkou B
    2. Bearish when SenkouB > Senkou A
    3. Consolidation when Senkou A = Senkou B

  9. Cloud strength

    1. Strong Bullish

      1. Future kumo is bullish and both future Senkou A (SA) and Senkou B (SB) are pointing up

    2. Medium Bullish

      1. Future kumo is bullish, future SA is up and future SB is flat

    3. Weak Bullish

      1. Future kumo is bullish, future SA is down and future SB is flat -

        1. This can be a ‘major pullback or trend reversal’

    4. Bearish sentiment is simply the reverse of these

  10. Kumo shadow is a cloud that exists behind price - created from past consolidation - ‘major’ S&R (everything is ‘major’ in this book so far)


Attached Image (click to enlarge)
Click to Enlarge

Name: pasted image 0 (2).png
Size: 219 KB

“Price behind the shadow created the shadow”


  1. Flat SB of the kumo cloud is a ‘major’ support and resistance value. The longer it is flat the the greater the support/ resistance
  2. Peaks created by the SA of the kumo cloud are ‘major’ support and resistance values
  3. Spacing between SA and SB (the size of the cloud then?) represents volatility
  4. The thicker the future cloud, the more consolidation there has been
  5. When a ‘major’ trend occurs the future kumo cloud will be thin with both SA and SB pointing in the direction of the cloud

Attached Image (click to enlarge)
Click to Enlarge

Name: pasted image 0 (3).png
Size: 220 KB
 
2
  • Post #626
  • Quote
  • Nov 24, 2021 2:44pm Nov 24, 2021 2:44pm
  •  OwaisJam
  • Joined Feb 2018 | Status: Digger1 Apprentice | 947 Posts | Invisible
Quoting clemmo17
Disliked
Kumo Cloud components Senkou Span A Dark Blue {image} Senkou Span B Purple {image} The cloud is formed by filling the space with colour between the two lines, where red is bearish and yellow is bullish If A > B then the colour is bullish If B > A then the colour is bearish Confusing because there are really 2 clouds - the past and the future Current price movement affects the future The current values are in the future, the values in the past are 26 or 52 periods old Sentiment Bullish when price is above the cloud Bearish when below the cloud Consolidating...
Ignored
gonna try this on demo dont know why i feel it will be very good addiotion for swing trading...
 
1
  • Post #627
  • Quote
  • Nov 25, 2021 8:23am Nov 25, 2021 8:23am
  •  clemmo17
  • Joined Jul 2016 | Status: Member | 1,600 Posts
Quoting OwaisJam
Disliked
{quote} gonna try this on demo dont know why i feel it will be very good addiotion for swing trading...
Ignored
Let us know how it goes!
 
1
  • Post #628
  • Quote
  • Nov 25, 2021 8:24am Nov 25, 2021 8:24am
  •  clemmo17
  • Joined Jul 2016 | Status: Member | 1,600 Posts
Chapter 2 - Ichimoku Trading Plan

  1. To his credit MP comes up with an experimental plan to test the use of IKH
  2. The rules are:

    1. Only trade currencies
    2. No more than 4 at a time
    3. Max 20% funds allocated
    4. No margin
    5. No add-on positions
    6. Only backtested instruments can be traded
    7. No decision-making - follow the plan with no exceptions
    8. Evaluate trades on a monthly basis
    9. D1 TF only
    10. Only spot FX - no options
    11. Analyze instrument once and place alerts or entries for bull/bear sides
    12. Don’t look at the instrument again until alert/entry is triggered
    13. All alerts re-adjusted weekly
    14. Place alerts below resistance and above ‘major’ support so that an entry can be placed before the ‘major’ action happens

Very interesting - shades of Dirk Du Toit in its simplicity and I especially like the rule about not examining the trade again after placing alerts. I dither too much and am fond of messing with the original plan when I trade manually.

Strategy Description

  1. Use different values depending on volatility - each instrument is different. Use ATR for ‘the buffer’ (?)
  2. Entry rules (for a long trade I assume)

    1. Price must be above kumo cloud
    2. Tenkan san is > than kijun sen
    3. Chikou is showing strong bullish momentum (open space)
    4. At least 50 pips to the next ‘major’ S&R value
    5. Kumo future is bullish
    6. Entry has to be < 200 pips from the tenkan sen. If not, wait for it to come back.
    7. Entry has to be < 300 pips from the kijun sen. If not, wait.
    8. Entry ‘buffers’ = 40 pips
    9. All IKH indicators must be bullish

  3. Money Management

    1. If price is > 200 pips from TS, exit if TS is flat
    2. If profit is >= 300 pips, use TS with buffer as the stop
    3. Exit buffer = 40 pips
    4. Place or adjust the bullish alert
    5. Adjust stops daily
    6. Place alert at Kijun sen to cancel entry orders


Rules are reversed for bearish strategy

I’m quite looking forward to testing this out. However Chapter 3 is about backtesting so let’s check that out first, shall we?

 
1
  • Post #629
  • Quote
  • Nov 25, 2021 3:06pm Nov 25, 2021 3:06pm
  •  clemmo17
  • Joined Jul 2016 | Status: Member | 1,600 Posts
Chapter 3 - Backtesting

  1. If you know how someone trades you can calculate the statistics of their system and evaluate its success
  2. The way to look at systems is not by checking winning trades but by checking losing ones; in a bull run any system can perform well
  3. In 2008 some traders lost 4+years of profits in 3 months
  4. MP listened to his mentor to understand how he traded and then he validated his advice through backtesting
  5. After backtesting that person instantly became his mentor
  6. His mentor ‘did not understand the concept of backtesting’ (!) so all his advice was live
  7. His mentor only knew about the currency market
  8. MP backtested over 6 months on stocks, futures, currencies, bonds
  9. MP now has different trading plans for different market situations, surpassing his mentor he figures


EURUSD - a 2 year backtest
Now this is what I’m talking about. A book that actually shows how a system performs on a specific period of history that we can check - and it’s not cherry-picked data - starting Jan. 1, 2007 - November 9, 2009 (well we’re going to go to the end of 2009). Then we can check a different sample of data on the same instrument and see how the performance compares. A real backtest. Why don’t more book authors do this? I have no idea except that it really pads the book out, which you would think, is a bonus for authors.

MP begins with the status of the indicators on Jan. 1, 2007

  1. Price versus Kumo Cloud: Bullish
  2. TS versus KS relationship: Bullish
  3. Distance from TS: 1.3272 - 1.3189 = 0.0083 = 83 pips-within 200 pips specified in the trading plan
  4. Distance from KS: 1.3272 - 1.3154 = 0.0118 = 118 pips (within 300 pips specified in trading plan).
  5. In Kumo Cloud: No (within a Kumo Cloud indicates consolidation).
  6. Tenkan Sen Trend: Yes (pointing in bullish direction).
  7. Kijun Sen Trend: Yes (slightly pointing in bullish direction and has not been flat for a long time)
  8. Chikou: Bullish (above price from 26 days ago)
  9. Horizontal prediction: Weak, can run into price if it consolidates for four or more days.
  10. Vertical prediction: Weak, a I00 pip movement down can make the Chikou touch price from 26 days ago.
  11. Trending Criteria requirement: If price can clear the last ultimate high, which is less than 100 pips away, it has a chance to get into a strong "open area." In the "open area" the bullish trend can develop some momentum.
  12. Future Cloud: Bullish.
  13. Senkou A Trending: Yes: Pointing in direction of trend.
  14. Senkou B Trending: Yes: Pointing in the direction of the trend.
  15. Thickness of Future cloud: Thick: Indicates that the trend may not be a long-term trend, more medium- to short-term trend.
  16. Kumo Shadows: No: within a 12-month period.
  17. This is a lot to keep track of. A checklist might help (update: there is one at the back of the book - remind me to add it later)
    Attached Image (click to enlarge)
    Click to Enlarge

Name: pasted image 0.png
Size: 187 KB

 
2
  • Post #630
  • Quote
  • Nov 26, 2021 6:13am Nov 26, 2021 6:13am
  •  OwaisJam
  • Joined Feb 2018 | Status: Digger1 Apprentice | 947 Posts | Invisible
Quoting clemmo17
Disliked
{quote} Let us know how it goes!
Ignored
Sure mate these days i am trying to solve some issues regarding PA once i get it then i will combine Ichimoku with my chart
 
1
  • Post #631
  • Quote
  • Nov 26, 2021 7:45am Nov 26, 2021 7:45am
  •  clemmo17
  • Joined Jul 2016 | Status: Member | 1,600 Posts
So - all indicators are bullish. MP points out that if the price bars were removed from the chart we could tell what had happened to price just with the cloud.

  1. The future kumo cloud indicates a trend has developed already and we’re looking at a trend continuation due to the thickness of the cloud and the future SA pointing up
  2. Chikou tells us that we should not enter unless price reaches our bullish alert (close to the ultimate high) where it has a chance to gain momentum (how does Chikou tell us this? Because there isn’t enough open space around it yet?)
  3. Now place our bullish and bearish alerts and wait for them to trigger

    1. Bearish alert below the kijun sen or at the kumo cloud
    2. MP chooses the cloud because it is thick
    3. If the cloud were thin he would use KS because price could go right through a thin cloud
    4. Bullish alert - look at highest Chikou peak and place it below that peak

      1. “If we put an alert below the highest peak in the Chikou Span line then we have a chance to place an entry trade before the last high is exceeded.”

  4. You don’t want to miss an opportunity because if you do you have to wait for the next trade which might take a while
  5. Bearish alert was triggered Jan. 11 2007


Again MP gives us the complete status of all indicators for that day.

  1. Price versus Kumo Cloud: Bearish: The closing price is below Kumo Cloud
  2. TS versus KS relationship: Bearish
  3. Distance from TS: 1.3088 - 1.2891 = 0.0097 = 97 pips-within 200 pips specified in trading plan
  4. Distance from KS: 1.3123 - 1.2891 = 0.0232 = 232 pips (within 300 pips specified in trading plan).
  5. In Kumo Cloud: No, but it will be soon. It is a thick cloud.
  6. Tenkan Sen Trend: Yes: Pointing in the bearish direction.
  7. Kijun Sen Trend: Yes: Pointing in the bearish direction.
  8. Chikou: Bearish (below price from 26 days ago)
  9. Horizontal prediction: Strong Bearish.
  10. Vertical prediction: Strong Bearish.
  11. Trending Criteria requirement: It is in open space already.
  12. In Kumo Cloud: No, within a Kumo Cloud indicates consolidation

  1. Kumo Cloud (Figure 3. 12)

    1. Future Cloud: Bullish
    2. Senkou A Trending: No: Pointing in opposite direction of trend.
    3. Senkou B Trending: Yes, slightly pointing up still.
    4. Thickness of Future Cloud: Future Kumo Cloud is thinning now with Senkou A moving down to meet Senkou B. Either we are in a major pullback or a trend reversal
    5. Kumo Shadows: No, within 12-month period.


There is conflict among all these indicators so alerts are reset.
Bearish alert is set above the next major support. If you’re unsure, choose the most conservative location. It is better to be alerted too often than to miss a major move.
The bullish alert is moved to the top of the kumo cloud.
Bullish alert is triggered Feb. 26, 2007.
MP points out a mistake - that alerts were supposed to be placed below the major resistance level.
Alert was placed at top of kumo cloud on Jan. 11.

Attached Image (click to enlarge)
Click to Enlarge

Name: pasted image 0.png
Size: 224 KB

Erroneous

Attached Image (click to enlarge)
Click to Enlarge

Name: pasted image 0 (1).png
Size: 205 KB

Correct

Hmm, complicated, but interesting. Can I make sense of it?

MP continues to make status updates and show charts as each alert is triggered. When do we trade though?

One issue I can see is that if anything goes out of whack at any point, we’re required to exit the trade immediately. This seems like it would cause a lot of false starts.
 
 
  • Post #632
  • Quote
  • Nov 26, 2021 12:28pm Nov 26, 2021 12:28pm
  •  clemmo17
  • Joined Jul 2016 | Status: Member | 1,600 Posts

  1. Verify all Ichimoku indicators are "ok."
  2. If not, exit the position immediately
  3. Verify price has not "escaped" the Tenkan Sen or Kijiun Sen. If so, follow trading plan and exit if needed
  4. Adjust Stops and Alerts.
  5. After adjusting, if the risk is now greater than the one allocated in the trading plan, exit right away.


Attached Image (click to enlarge)
Click to Enlarge

Name: pasted image 0.png
Size: 221 KB

MP finally enters a trade on Feb. 27 2007


  1. Entry at Major Resistance = 1.3196
  2. Entry = Major Resistance + 40 (buffer) = 1.3236.
  3. Stop at Kijun Sen = 1.3033:
  4. Stop = Kijun Sen minus Exit Buffer (40) = 1.2993.
  5. Preserve Mode (explained later): Change Stop to Tenkan Sen = Entry + 300 pips = 1.3486.
  6. Alert set up at the KS - if the bullish entry isn’t triggered the alert reminds us to remove the entry and place a bullish alert instead

Now he follows the MM plan.

Attached Image


A "Free Trade" is where the stop is above the entry for a bullish position.

So I presume the reverse is true.
 
 
  • Post #633
  • Quote
  • Nov 26, 2021 12:33pm Nov 26, 2021 12:33pm
  •  clemmo17
  • Joined Jul 2016 | Status: Member | 1,600 Posts
Attached Image (click to enlarge)
Click to Enlarge

Name: pasted image 0.png
Size: 242 KB

If we get stopped out on a free day - there will be no loss. In ‘many’ strategies this is a chance for an add-on, but MP implies this is not such a strategy.

Attached Image (click to enlarge)
Click to Enlarge

Name: pasted image 0 (1).png
Size: 243 KB

Preserve Mode - stop is moved from KS to the TS to tighten it. Preserving profits. MP is guaranteed 200 pips even if the stop is hit.

Remember to adjust bearish alerts even though you’re in a bull trade.

The trade exits on May 2, 2007. Record all stats for post-analysis.

Attached Image (click to enlarge)
Click to Enlarge

Name: pasted image 0 (2).png
Size: 259 KB


Attached Image (click to enlarge)
Click to Enlarge

Name: pasted image 0 (3).png
Size: 86 KB


MP points out that had the preserve mode amount been 200 pips instead of 300 the trade would have stopped out much earlier in the trend.

MP says the allowance for distance from the KS can increase ‘because...entry is higher than where it is now.” But he doesn’t specify by how much. Otherwise, Chikou span is still in open space, and there have been no major pullbacks. Since all the indicators indicate the trend continues we setup for a new trade.
 
 
  • Post #634
  • Quote
  • Nov 26, 2021 1:12pm Nov 26, 2021 1:12pm
  •  clemmo17
  • Joined Jul 2016 | Status: Member | 1,600 Posts

  1. May 10, 2007 the KS alert is triggered, this might be a trend change so the entry (pending order?) is changed to an alert. MP calls them ‘floating entries’ but now we know he means ‘pending order’.
  2. June 8, 2007 bearish alert is triggered. We have 2 concerns says MP:

    1. At this point both the KS and TS are in the cloud.
    2. Next support is at 1.3291 which is < 50 pips away
    3. To resolve these we’ll place an entry below the next support level
    4. That should resolve both issues, but if not we’ll exit the same day
    5. MP points out that he is predicting where price should be in order to resolve IKH conflicts.

  3. June 22, 2007 KS alert is triggered - entries become alerts - a bearish trade is missed by only 5 pips

Attached Image (click to enlarge)
Click to Enlarge

Name: pasted image 0.png
Size: 240 KB

And it would have been a loss. The buffer kept MP out of this losing trade.

Attached Image (click to enlarge)
Click to Enlarge

Name: pasted image 0 (1).png
Size: 211 KB

After the entry values are removed the alerts are placed as shown in the chart. It was decided by MP to put the bullish alert up ‘very high’. No entry is placed above the kumo cloud because there is not more than 50 pips between resistance values. ‘The safest thing to do’ is place an alert below the high shown.
 
1
  • Post #635
  • Quote
  • Nov 26, 2021 4:57pm Nov 26, 2021 4:57pm
  •  clemmo17
  • Joined Jul 2016 | Status: Member | 1,600 Posts
July 2, 2007 - bullish alert is triggered

  1. TS and KS are in the kumo cloud
  2. An entry at 1.3715 - 35 pips above the previous high, should see the TS and KS exit the cloud because it is thin
  3. If the KS stop is a 35 pip buffer, the stop would be at 1.3414 and entry would be 1.3715 which is 301 pips not 300. The difference is insignificant says MP and so he proceeds as planned.
  4. MP then sets up a trap for the reader by asking them if they are ready to go ahead with the next trade! Are they? Of course they are! Traders are impatient by nature.
  5. You just violated your trading plan if you said ‘yes’, MP tells us !
  6. What was the mistake (I have no flipping idea)
  7. Mercifully, MP tells us: it was that we used the short side (bearish) buffer for entry and also for the stop level. We are supposed to use 40 pips instead of 35 (??)

Honestly, at this point I’m just reading the book and trying to get down the important facts before I go trying to figure out this somewhat convoluted system. It seems legit so far though.


  • Post #636
  • Quote
  • Nov 26, 2021 4:59pm Nov 26, 2021 4:59pm
  •  clemmo17
  • Joined Jul 2016 | Status: Member | 1,600 Posts

  1. July 10, 2007 - trade entered on bullish side

Attached Image

July 31, 2007 - almost stopped out - but the 40 pip buffer holds with 5 pips to spare
MP says we’ll talk about optimization in chapter 4.

August 9, 2007 - stopped out of the trade with a loss. 46 pips lost out of our initial risk stop of 267 pips. There are only 2 cases where we’d get stopped out at initial risk says MP


  1. An error interpreting IKH - someone missed that not all 5 indicators were GO
  2. Random events - a drastic gap in a short period of time. This can happen which is why we always use a stop and never risk 100%


I have to admit this is a little underwhelming so far. 2 trades, 1 win and 1 loss with a lot of work managing long-term trades. It obviously needs to be tested for a longer time period though.

Attached Image

It seems like all this extra caution should virtually eliminate losing trades -otherwise what’s the point?!

Now MP shows the chart setup with alerts again. He does not set an entry for the bullish continuation trade because the Chikou span is too close to the price. There is no harm in placing an alert, says MP.
 
 
  • Post #637
  • Quote
  • Nov 26, 2021 5:01pm Nov 26, 2021 5:01pm
  •  clemmo17
  • Joined Jul 2016 | Status: Member | 1,600 Posts
Aug. 14 2007 - Bearish alert triggered; the chart says we’re not ready for an entry yet. Reset alerts and continue testing.

Aug. 15, 2007 - bearish alert triggered again. Again the charts say we’re not ready. A pullback will ‘equalize the variables’ and set up a bearish trade, says MP. Reset alerts once more.
This time entries are set up to trigger before the kumo shadow top/bottom. This is to set up entries for breaking out of the kumo shadow. (is kumo shadow == cloud??)

Attached Image (click to enlarge)
Click to Enlarge

Name: pasted image 0.png
Size: 190 KB

Alerts reset
Over the following 3 days, more bearish alerts are received, ‘pushing our alerts down more and more’ but no trade is entered as it’s dangerous to enter a trend that is mature. The Ichimoku signals are ‘not set up yet’.

MP admits that we have ‘missed the big move’ but ‘at least we did not lose any money’. True, but this seems timid.

One of the goals for this trading plan is to work on all time frames and all currency instruments. Too ambitious, probably.

The plan will not be adjusted just to capture this movement. MP wants to ‘keep it simple’. Adjusting to fit conditions is ‘curve fitting’ says MP.

MP is continually setting traps for the reader, for example showing them the following chart and asking if the trade is ready.
Attached Image

If you entered here, says MP, you violated the trading plan. Why? Unclear. MP just tells us that the bearish side has a different set of rules than the bullish side.

More charts (so many) and still no entries.

MP continues to show us charts, alerts, but no entries until finally price turns bullish on August 31, 2007.
 
 
  • Post #638
  • Quote
  • Nov 27, 2021 9:24am Nov 27, 2021 9:24am
  •  OwaisJam
  • Joined Feb 2018 | Status: Digger1 Apprentice | 947 Posts | Invisible
Quoting clemmo17
Disliked
May 10, 2007 the KS alert is triggered, this might be a trend change so the entry (pending order?) is changed to an alert. MP calls them ‘floating entries’ but now we know he means ‘pending order’. June 8, 2007 bearish alert is triggered. We have 2 concerns says MP: At this point both the KS and TS are in the cloud. Next support is at 1.3291 which is < 50 pips away To resolve these we’ll place an entry below the next support level That should resolve both issues, but if not we’ll exit the same day MP points out that he is predicting where price...
Ignored
Hey clemmo!!!
Mate i did check ichimoku looks an amazing tool to be used though it looks like mess thats why i never used it but after checking it i am sure it is an excellent thing
My strategy for ichimoku will be dont look for reversal untill the lagging line green one is above the candles in up trend once candles cross it u try to find a reversal if u know reversal is done wait for blue line to be crossed then u wait for PA once PA is confirmed u should enter...
I have checked it on all tf of gold looks good to me if i trade it like this.
Most important thing is u must know trend has reversed or not otherwise it cant be fruitfull.
real results can only be achieved on live chart lets see what happens untill next Friday...
Attached Image (click to enlarge)
Click to Enlarge

Name: Screenshot (13).png
Size: 45 KB
 
 
  • Post #639
  • Quote
  • Nov 27, 2021 9:55am Nov 27, 2021 9:55am
  •  OwaisJam
  • Joined Feb 2018 | Status: Digger1 Apprentice | 947 Posts | Invisible
If reversal hasnt been made and candles have crossed blue line then u wont look for PA to buy only look for buy PA when blue line is crossed again in the direction of trend i am gonna ignore clouds coz i am swing trader and i trade on smaller tf they are looking no use to me at this moment may be they are...
trying to understand higher tf as well
 
1
  • Post #640
  • Quote
  • Nov 28, 2021 9:03am Nov 28, 2021 9:03am
  •  clemmo17
  • Joined Jul 2016 | Status: Member | 1,600 Posts
Quoting OwaisJam
Disliked
If reversal hasnt been made and candles have crossed blue line then u wont look for PA to buy only look for buy PA when blue line is crossed again in the direction of trend i am gonna ignore clouds coz i am swing trader and i trade on smaller tf they are looking no use to me at this moment may be they are... trying to understand higher tf as well
Ignored
Do you think the IKH lines give you more information than ordinary (simple/smoothed/triangular) moving averages?
 
1
  • Trading Discussion
  • /
  • The Finance Book Club
  • Reply to Thread
    • 1 3031Page 323334 42
    • 1 31Page 3233 42
1 trader viewing now
  • More
Top of Page
Forex Factory Blog Updated: Alerting All Members
  • Facebook
  • Twitter
About FF
  • Mission
  • Products
  • User Guide
  • Media Kit
  • Blog
  • Contact
FF Products
  • Forums
  • Trades
  • Calendar
  • News
  • Market
  • Brokers
  • Trade Explorer
FF Website
  • Homepage
  • Search
  • Members
  • Report a Bug
Follow FF
  • Facebook
  • Twitter

FF Sister Sites:

  • Metals Mine
  • Energy EXCH
  • Crypto Craft

Forex Factory® is a brand of Fair Economy, Inc.

Terms of Service / ©2022