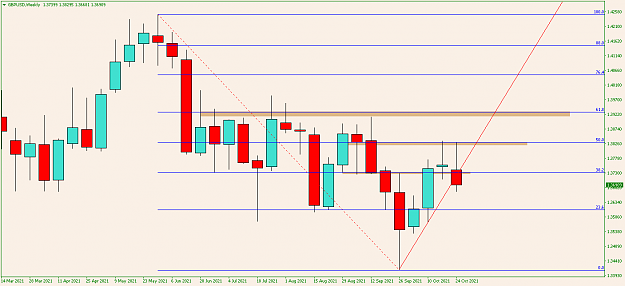
Based on the fact the daily is down and weekly is up making the daily swing corrective , i was racking my brains to work out what the strange pattern was on H1, well the answer lays in the running flat, probably one of the most difficult corrective patterns to recognise let alone trade as we saw today most traders only caught on to the short more than half way through the swing down after the running flat.
So it is a possibility that next week will be bullish after the daily correction and we shall move back inline with the weekly.
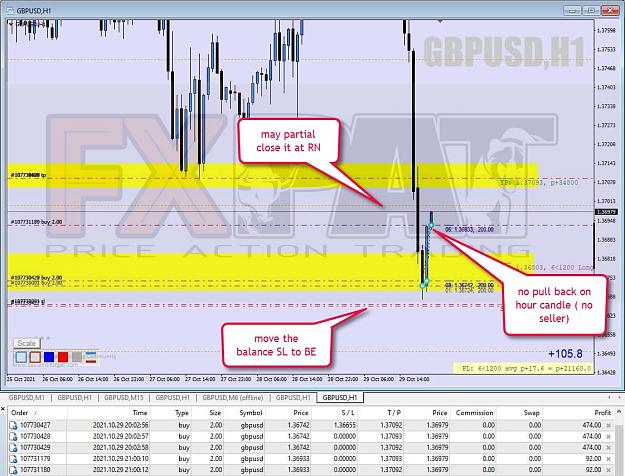
In case anyone is wondering why i look at daily and weekly but trade off the hourly , it is due to the fact the internal structure of the daily at its lowest level is to be found on H1 in the form of the larger degree swings, you can see in the price action chart the smaller waves that scalpers trade make up the larger degree swings that i look at and attempt to trade
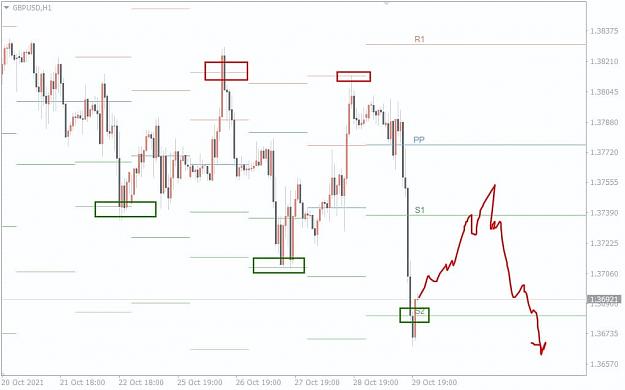
The one to the right is a running flat in a downtrend or down correction

Now take a look at the actual price action

So it is a possibility that next week will be bullish after the daily correction and we shall move back inline with the weekly.
In case anyone is wondering why i look at daily and weekly but trade off the hourly , it is due to the fact the internal structure of the daily at its lowest level is to be found on H1 in the form of the larger degree swings, you can see in the price action chart the smaller waves that scalpers trade make up the larger degree swings that i look at and attempt to trade
The one to the right is a running flat in a downtrend or down correction
Attached Image (click to enlarge)
Now take a look at the actual price action
Attached Image (click to enlarge)
Follow The Markets Structure - Patience and Discipline
3