Daddy, Brother, Lover, Little Boy
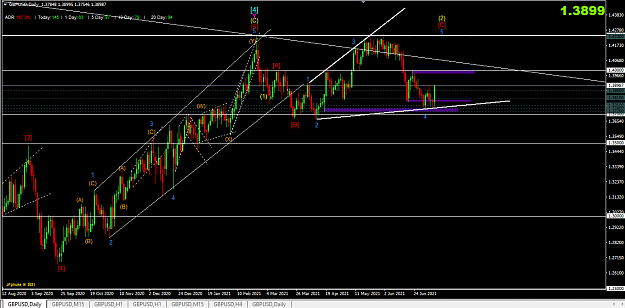
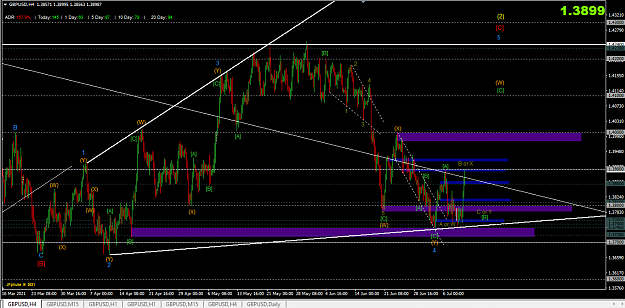
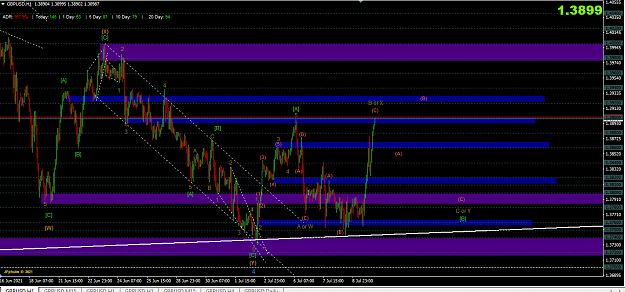
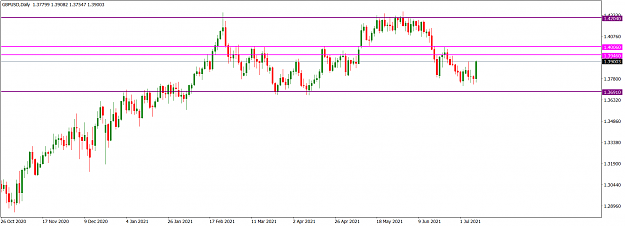
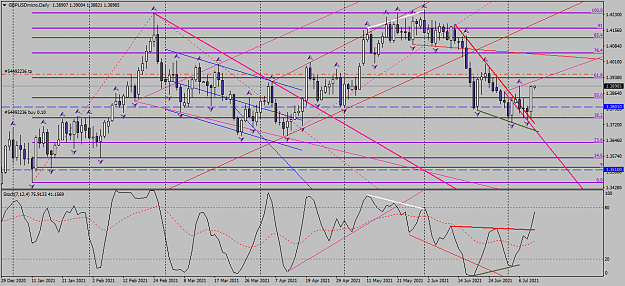
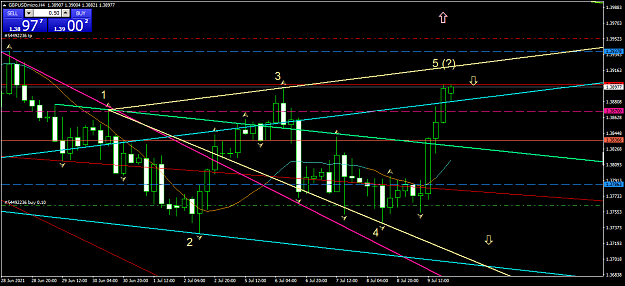
 Cable Update (GBPUSD)
- #608,621
- Jul 11, 2021 1:01pm Jul 11, 2021 1:01pm
- Joined Jul 2021 | Status: 2022 target achieved! | 1,036 Posts
- #608,622
- Jul 11, 2021 1:03pm Jul 11, 2021 1:03pm
- Joined May 2020 | Status: Best trader ever to exist ever | 10,711 Posts
- #608,623
- Jul 11, 2021 1:21pm Jul 11, 2021 1:21pm
- | Joined Dec 2008 | Status: MMA Pro Wrestler | 17,563 Posts

I come from the future.
Karen X Mas Bonus 2025 All Time Profit:
$15,104
- #608,624
- Jul 11, 2021 1:23pm Jul 11, 2021 1:23pm
- | Joined Dec 2008 | Status: MMA Pro Wrestler | 17,563 Posts
I come from the future.
Karen X Mas Bonus 2025 All Time Profit:
$15,104
- #608,628
- Jul 11, 2021 3:35pm Jul 11, 2021 3:35pm
- Joined Dec 2015 | Status: Trader | 8,782 Posts
Do your homework, follow the footprints of smart money
- #608,629
- Jul 11, 2021 5:02pm Jul 11, 2021 5:02pm
- Joined Aug 2018 | Status: Research Analyst | 4,295 Posts
Data + Stat + Risk/Emotions Management
- #608,630
- Jul 11, 2021 5:21pm Jul 11, 2021 5:21pm
- Joined Dec 2020 | Status: Re█████ | 2,877 Posts
Air force
- #608,631
- Jul 11, 2021 5:24pm Jul 11, 2021 5:24pm
- Joined May 2020 | Status: Best trader ever to exist ever | 10,711 Posts

- #608,634
- Jul 11, 2021 5:54pm Jul 11, 2021 5:54pm
- Joined Aug 2010 | Status: Trader | 5,476 Posts

dolce vita
- #608,635
- Jul 11, 2021 6:19pm Jul 11, 2021 6:19pm
- Joined Mar 2021 | Status: Crazy Frog | 3,775 Posts
"Buy Cheap and Sell Expensive , Its Market Anyways where People Get profit"
- #608,637
- Jul 11, 2021 6:46pm Jul 11, 2021 6:46pm
- | Commercial User | Joined Jul 2021 | 3,280 Posts
My telegram: https://t.me/avidforex
- #608,638
- Jul 11, 2021 7:01pm Jul 11, 2021 7:01pm
- Joined Aug 2010 | Status: Trader | 5,476 Posts
dolce vita
- #608,639
- Jul 11, 2021 7:10pm Jul 11, 2021 7:10pm
- Joined Aug 2010 | Status: Trader | 5,476 Posts
dolce vita
- #608,640
- Edited 8:01pm Jul 11, 2021 7:42pm | Edited 8:01pm
- Joined Apr 2020 | Status: Trader | 8,809 Posts
Trader with an Edge.