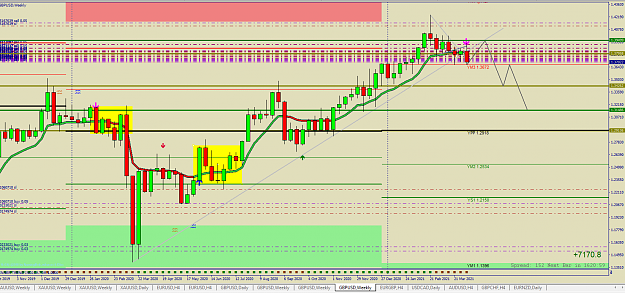
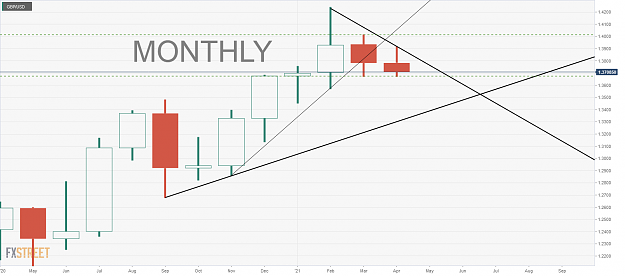
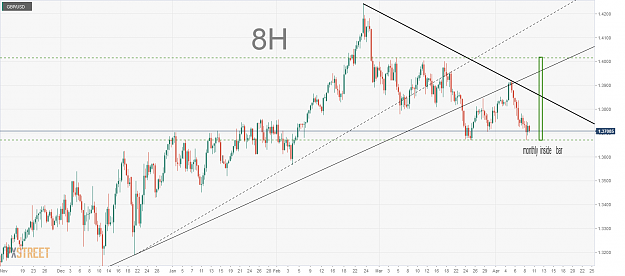
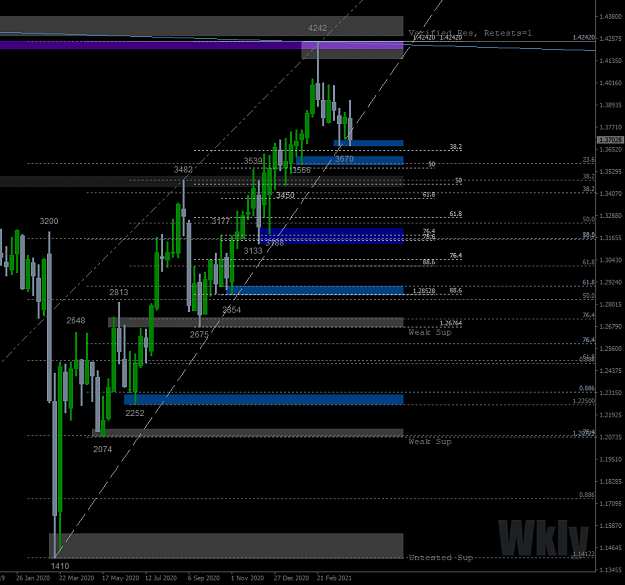
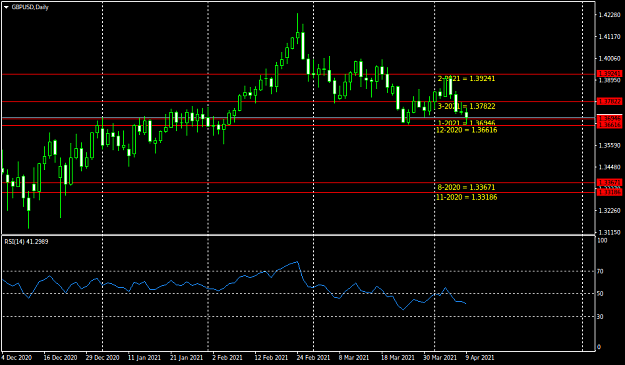
DislikedLONG TERM CHART is VERY INTERESTING: * 23/03 breakout UPTREND CHANNEL + BREAKOUT DOUBLE BOTTOM, so SHORT SIGNAL with P&F TP .3300. Week when COT shows how MOOD is CHANGING Now quotes are into DOWNTREND CHANNEL and DOUBLE BOTTOM is exactly 32% FIbonacci retrace .3650. THis is the LAST DEFENCE LINE for BULLs If it will be broken next REVERSAL ZONE Orange will be .345/.3300 according to P&F TP A return over .3950 will show all Bull Strenght & retest maximum I can be wrong but it's very evocative {image}Ignored
Nice Chart
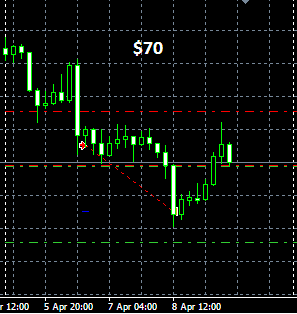
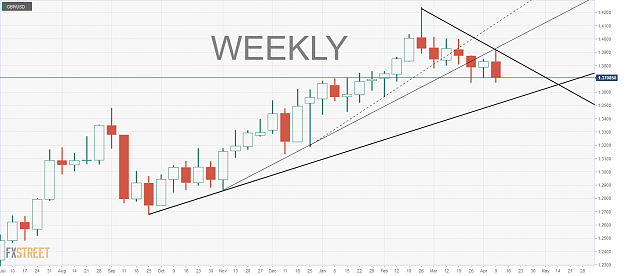
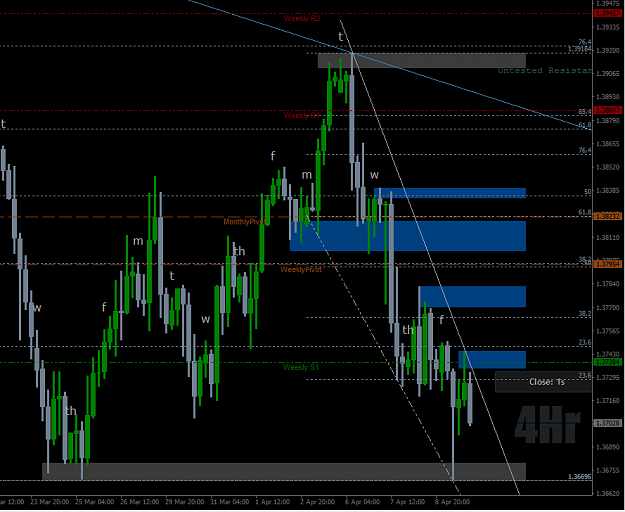
Market Structure Still point Gbp down currently. If it breaks 1.36820 probably more down
Nice charts crosses and zeros representing volume Clearly I would say
HAHA
Ok See You
1